Support
Mobile Trading App
PC Trading App
Web Trading Platform
Download
Markets![]() Commodities
Commodities
- Price

- Ideas

- Signal

- Chart

- About Market

Markets![]() Commodities
Commodities
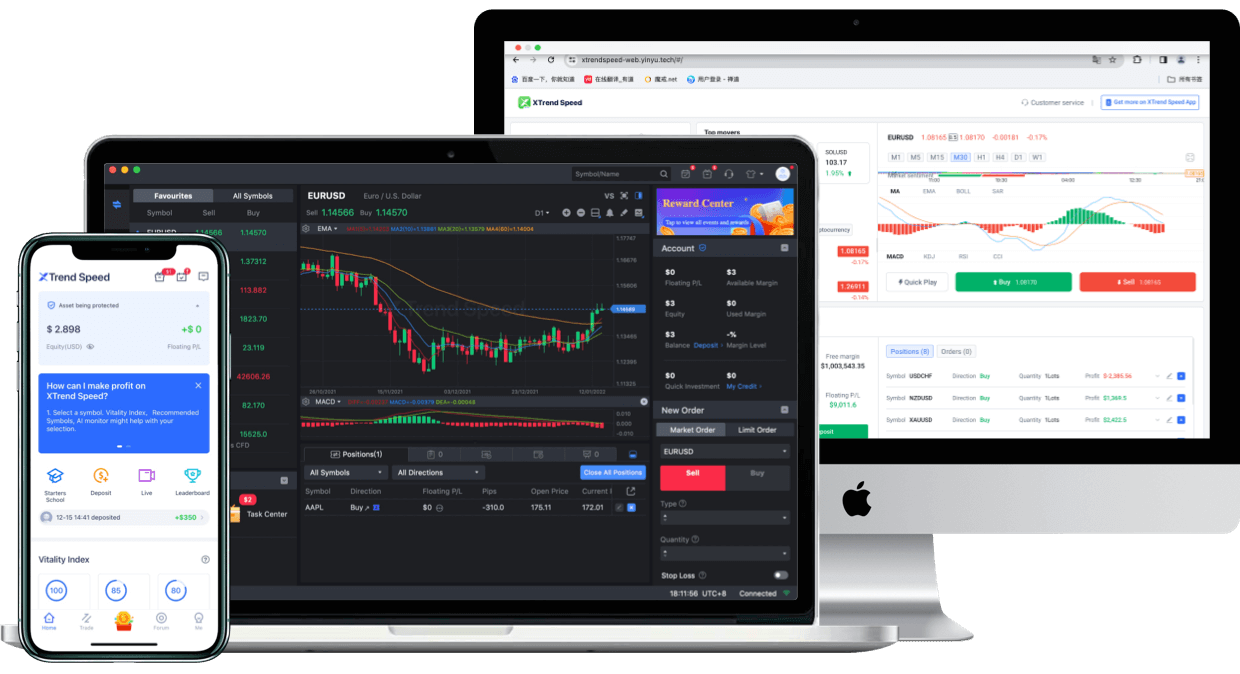
Commodity chart with technical indicators shows the real-time prices of commodities such as gold/silver/crude oil, as well as historical and current price trends. A commodity price chart can let traders view the market trend of each commodity intuitively. There are a bunch of functions for traders, such as market charts (Bars, Candles, Hollow Candles, Heikin Ashi, Line, Area, and Baseline), cycle analysis (minutes, hours, days), and more than 100 technical indicators on the commodity chart. XTrend Speed provides free commodity trading charts for investing charts commodity futures.
NICKEL
NICKEL
NICKEL
NICKEL


Mobile Trading App
PC Trading App
Past performance is not an indication of future results.
No Data

Mobile Trading App
PC Trading App
Web Trading Platform

AFA REGIONAL SPONSOR
Disclosure
xtrendspeed.com is owned and operated by Rynat Capital (Pty) Ltd.
Rynat Capital (Pty) Ltd,is an authorised financial service provider in South Africa with registration number 2004/005384/07 which is regulated by FSCA ( Financial Sector Conduct Authority) under the FSP license number 23497.
XTrend Speed is a product of Rynat Capital (Pty) Ltd and the product supplier/ liquidity provider is GBE Global Ltd.
Registered Office and Correspondence Address:
Business Address:
RISK WARNING
Risk Warning: Online trading is complex with high risks. Please invest cautiously.
Restricted Regions: XTrend Speed does not provide services to residents of certain jurisdictions, such as Afghanistan, Albania, United States, Bahamas, Barbados, Belarus, Belgium, Botswana, Burkina Faso, Burundi, Cambodia, Canada, China, Cyprus, North Korea, Democratic Republic of Congo, Republic of Congo, Ghana, Gibraltar, Iceland, Iraq, Jamaica, Jordan, Mali, Mongolia, Morocco, Mozambique, Myanmar, Nicaragua, Pakistan, Panama, Senegal, Sudan, Syria, Tanzania, Trinidad and Tobago, Uganda, Ukraine, Venezuela, Yemen, Zimbabwe, Russia, Kosovo, South Sudan, West of the Sahara, Greece.
 Trading Central
 Argentine Football Association
 ACF Fiorentina
 Visa/Mastercard
Online trading is complex with high risks. Please invest cautiously.
Online trading is complex with high risks. Please invest cautiously.
