
 MENU
MENU





Blogs About Trading
Technical Analysis: USDX
05.09.2024
USDX fell by pressure
On Wednesday, USDX fell by pressure. It ended down 0.50% at 101.26.
US JOLTs job vacancies in July were lower than expected
On Wednesday, the US Department of Labor released data showing that US job vacancies in July were 7.673 million, lower than the expected 8.1 million, falling to the lowest level since January 2021, and the previous value was revised down to 7.91 million.
The expansion of US economic activity slowed down
On Wednesday, the Federal Reserve Beige Book showed that the expansion of US economic activity slowed down from mid-July to late August, and companies reduced hiring. These signals highlight the reason why the Federal Reserve will start cutting interest rates later this month.
Technically speaking, the bearish market trend prevailed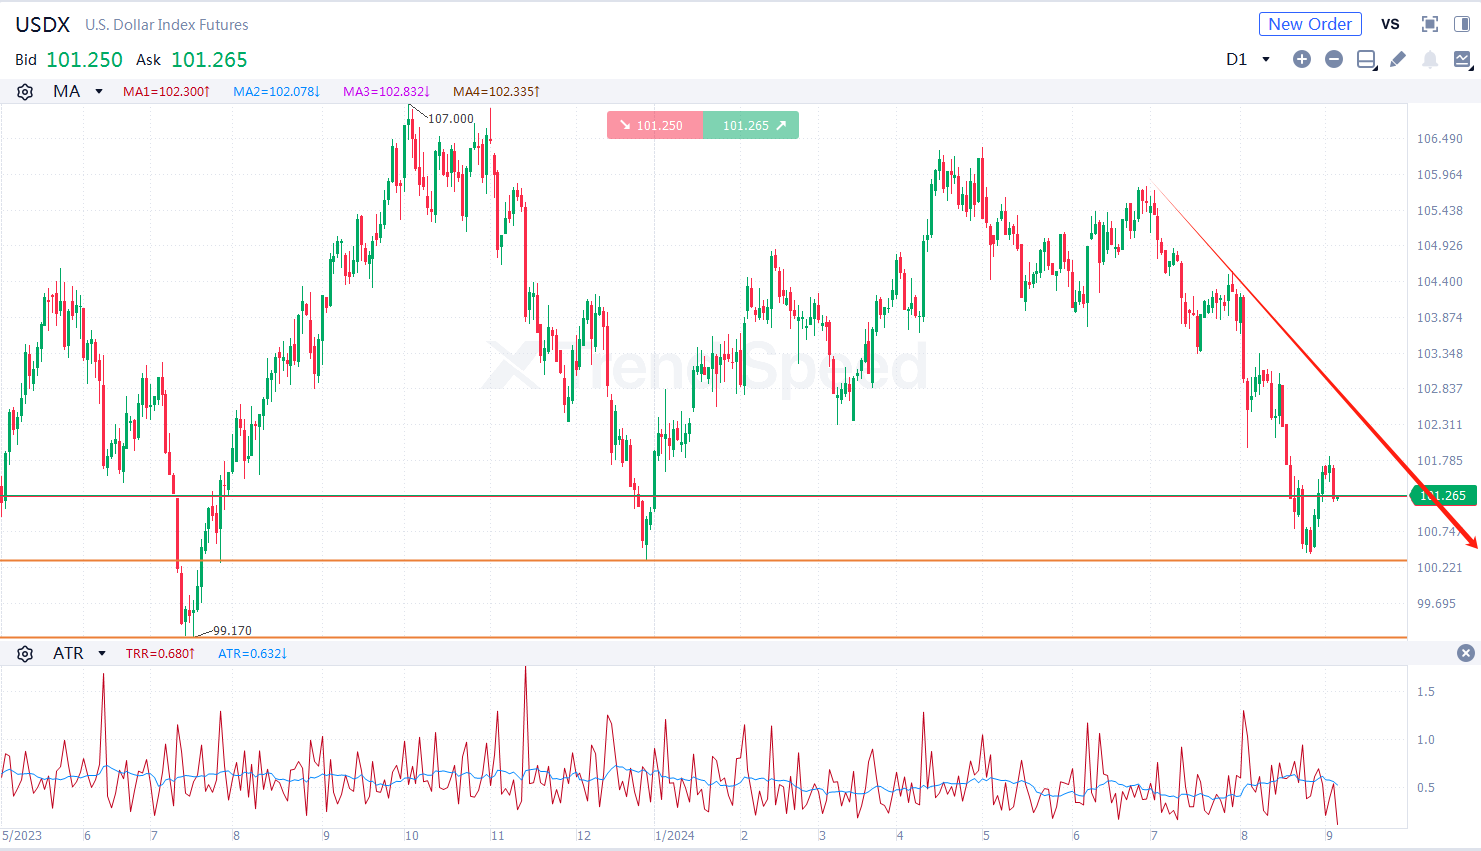
the Chart of the Day
On the chart of the day, the USDX fell yesterday. The bearish market trend prevailed in the short term. In terms of technical indicators, ATR went downwards after death cross occurred, showing the USDX will fall further. Investors should focus on whether the USDX will break through the support at 100.30. It will decline further with potential support at 99.20 if it breaks below 100.30.
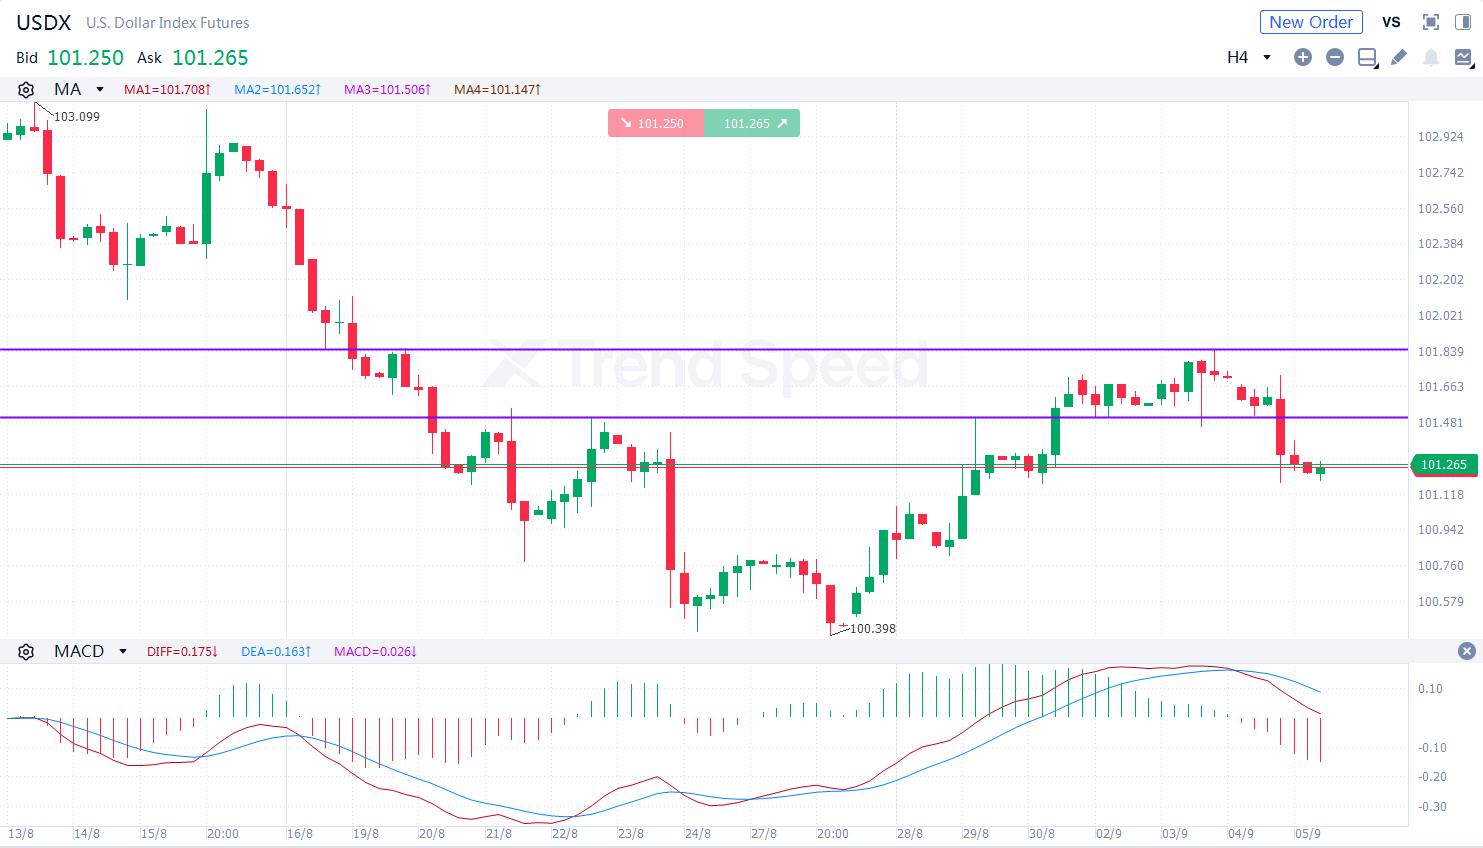 4-hour chart
On the 4-hour chart, the USDX was prone to fluctuation and decreased. The bearish market trend prevailed. In terms of technical indicators, MACD went downwards after death cross occurred, showing that the market trend is bearish. Investors should focus on whether the USDX will break through the resistance at 101.50. It will fall further if it rebounds but is capped at 101.50.
Key resistance: 101.50,101.85
Key support: 100.30,99.20
Generally speaking, lowered by multiple negative factors, USDX is more likely to fall in the short term. Investors should focus on US economic data during the day.
Hot
Is It Time to Buy USOIL on Dips as KDJ and MACD Golden Crosses Flash Buy Signals?
01.09.2026
Will US CPI Data Spark a Dollar Breakout or Further Losses for GBPUSD and NZDUSD?
07.09.2026
Is It Time to Sell EURUSD on Rebounds Below 1.162 as Fed Rate Hike Bets Rise?
31.08.2026
Bullish EURUSD Setup: 1.162 Support Holds as Price Tests 1.166 Resistance
10.09.2026
RBNZ, BOC, and US NFP Week: Key Levels for NZDUSD, USDCAD, and Gold
31.08.2026







 Trading Central
 Argentine Football Association
 ACF Fiorentina
 Visa/Mastercard