
 MENU
MENU




Blogs About Trading
Technical Analysis: GBPUSD
04.07.2024
GBPUSD reached a half-a-month high
On Wednesday, as the USDX fell and UK economic data was strong, GBPUSD climbed. It reached 1.2777 at one point, which marked the highest level since the 14th June.
US economic data was weak
US ADP Employment Change (June) fell to 150,000, which marked the lowest level since January 2024, according to the data from the Automatic Data Procession.
US Initial Jobless Claims (during the week ending on the 29th June) was 238,000 Vs. 235,000 (forecast), according to the data from the US Department of Labor.
US ISM Non-Manufacturing PMI (June) was 48.8 Vs. 52.5 (forecast), the Institute for Supply Management said. This figure marked the lowest level since May 2020.
US economic data was better than expected
UK Services PMI (June) was 52.1 Vs. 52.1 (forecast), and UK PMI (June) was 52.7 Vs. 51.7 (forecast), according to the data from Markit.
Technically speaking, the bullish market trend prevailed in the short term 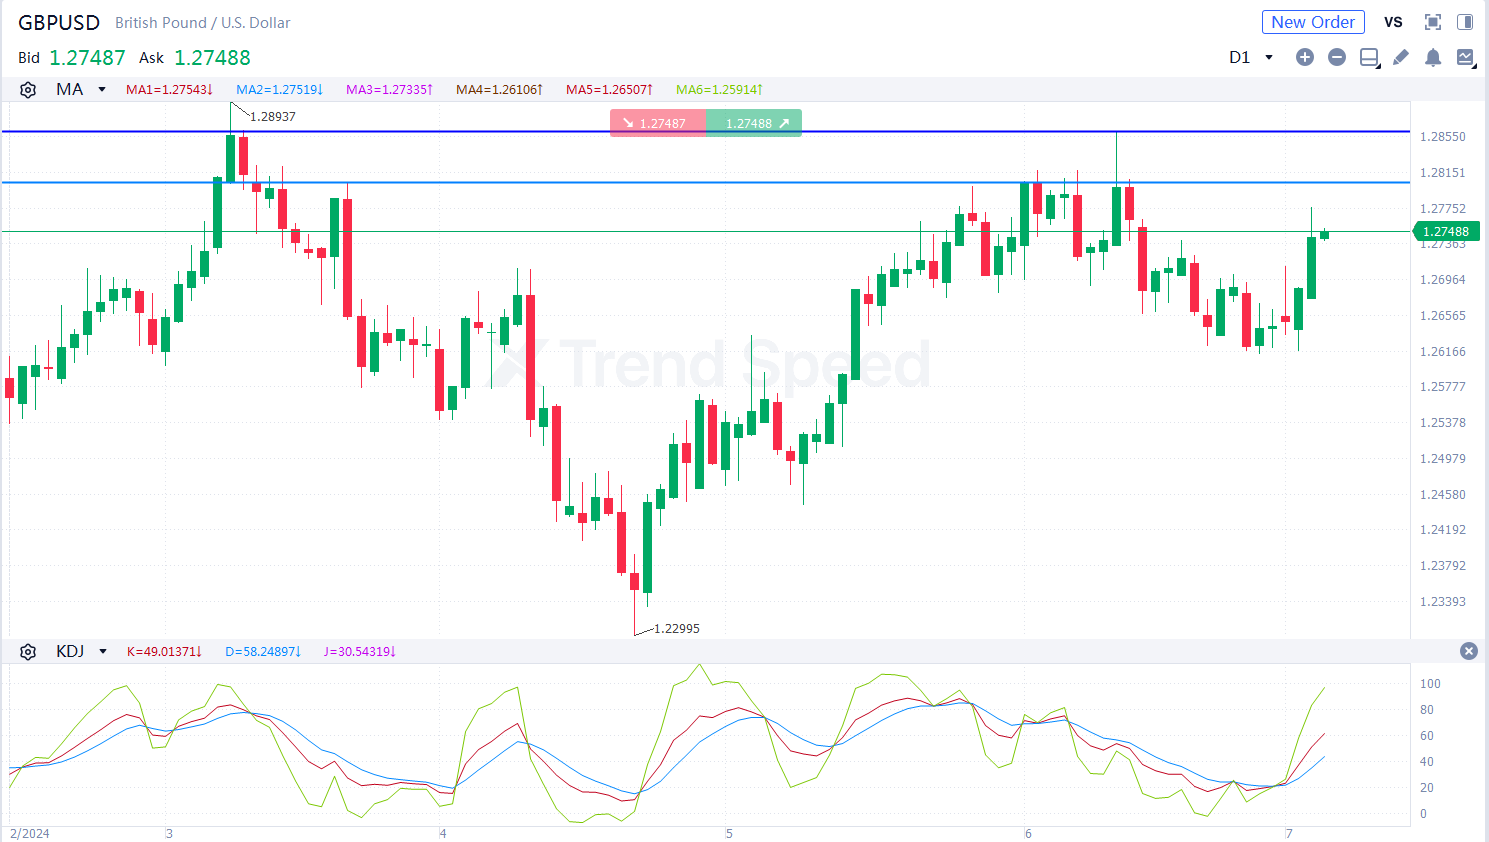
the Chart of the Day
On the chart of the day, GBPUSD climbed steadily. The bullish market trend prevailed in the short term. In terms of technical indicators, KDJ went upwards after golden cross occurred, showing GBPUSD will rise further. Investors should focus on whether GBPUSD will break through the resistance at 1.280. It will jump further with potential resistance at 1.286 if it breaks above 1.280.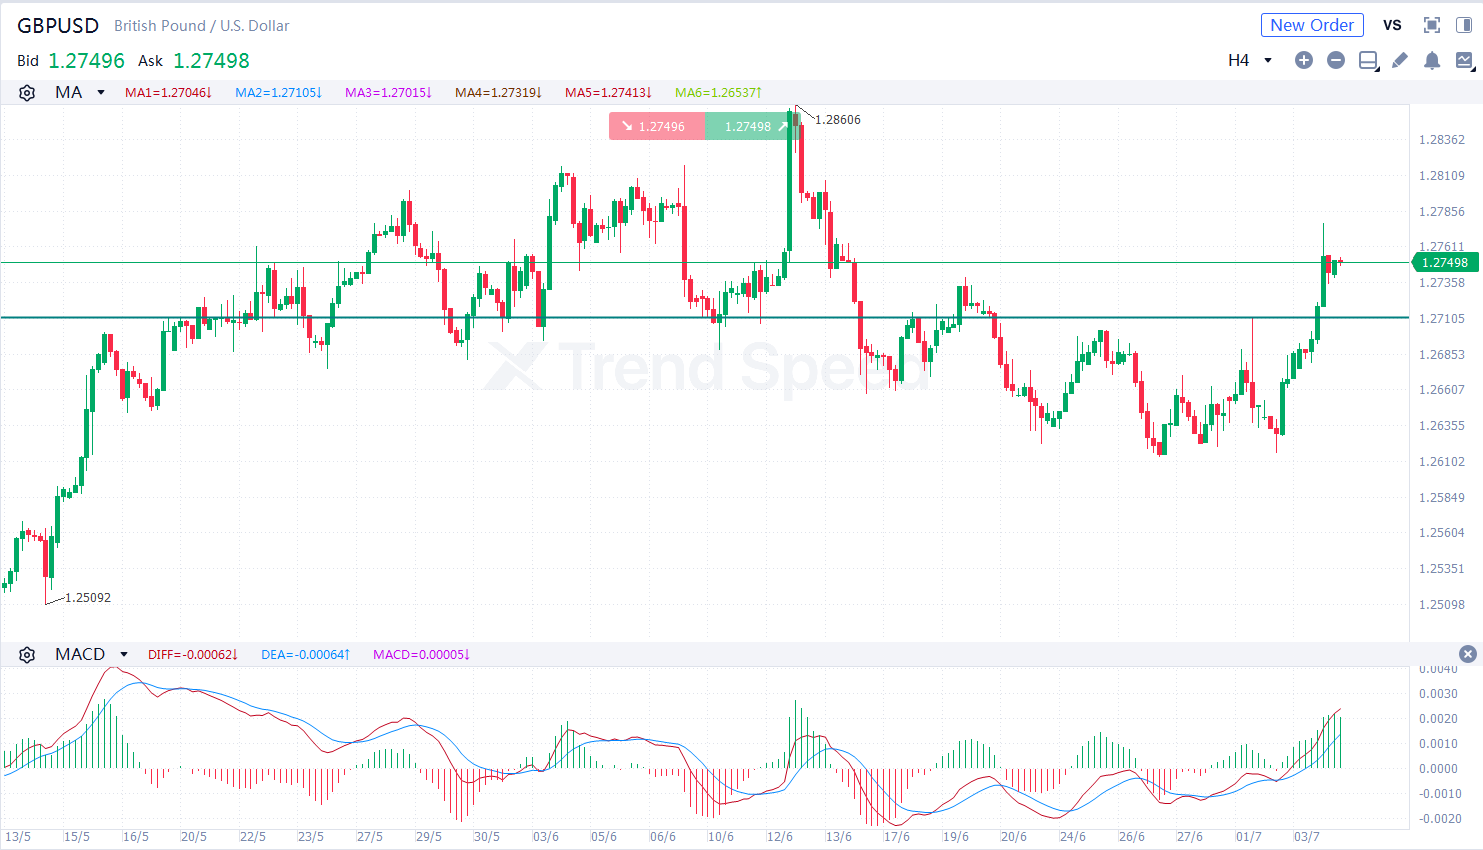
4-hour chart
On the 4-hour chart, GBPUSD was prone to fluctuation and climbed in the short term. The bullish market trend prevailed. In terms of technical indicators, MACD went upwards after golden cross occurred, showing that the market trend is bullish. Investors should focus on whether GBPUSD will break through the support at 1.271. It will rise further if it retreats but is stable above 1.271.
Key resistance: 1.280,1.286
Key support: 1.271,1.266
Generally speaking, boosted by positive factors, GBPUSD is more likely to rise further in the short term.
Hot
USDJPY Rose Above 159 on Iran Sanctions – Can Support at 159.0 Hold for a Push to 161.0?
25.08.2026
Is It Time to Buy USOIL on Dips as KDJ and MACD Golden Crosses Flash Buy Signals?
01.09.2026
Will US CPI Data Spark a Dollar Breakout or Further Losses for GBPUSD and NZDUSD?
07.09.2026
Is It Time to Sell EURUSD on Rebounds Below 1.162 as Fed Rate Hike Bets Rise?
31.08.2026
Bullish EURUSD Setup: 1.162 Support Holds as Price Tests 1.166 Resistance
10.09.2026







 Trading Central
 Argentine Football Association
 ACF Fiorentina
 Visa/Mastercard