

Support
Mobile Trading App
PC Trading App
Web Trading Platform
Download

Blogs About Trading
Technical Analysis: USOIL
30.04.2024
USOIL decreased by more than 1%
On Wednesday, USOIL fell for the second straight trading day. It ended down 1.19% at US$82.14 per barrel.
The situation in the Middle East eased
On Monday, as the situation in the Middle East eased, concerns on crude oil supply declined, putting pressure on USOIL.
US inflation lowered the expectation that the Fed will cut the interest rate
US PCE, y/y (March) increased by 2.8% Vs. 2.7% (forecast), according to the data from the US Department of Commerce last Friday. As US inflation remains high, the expectation that the Fed will cut the interest rate declines.
The bearish market trend prevailed
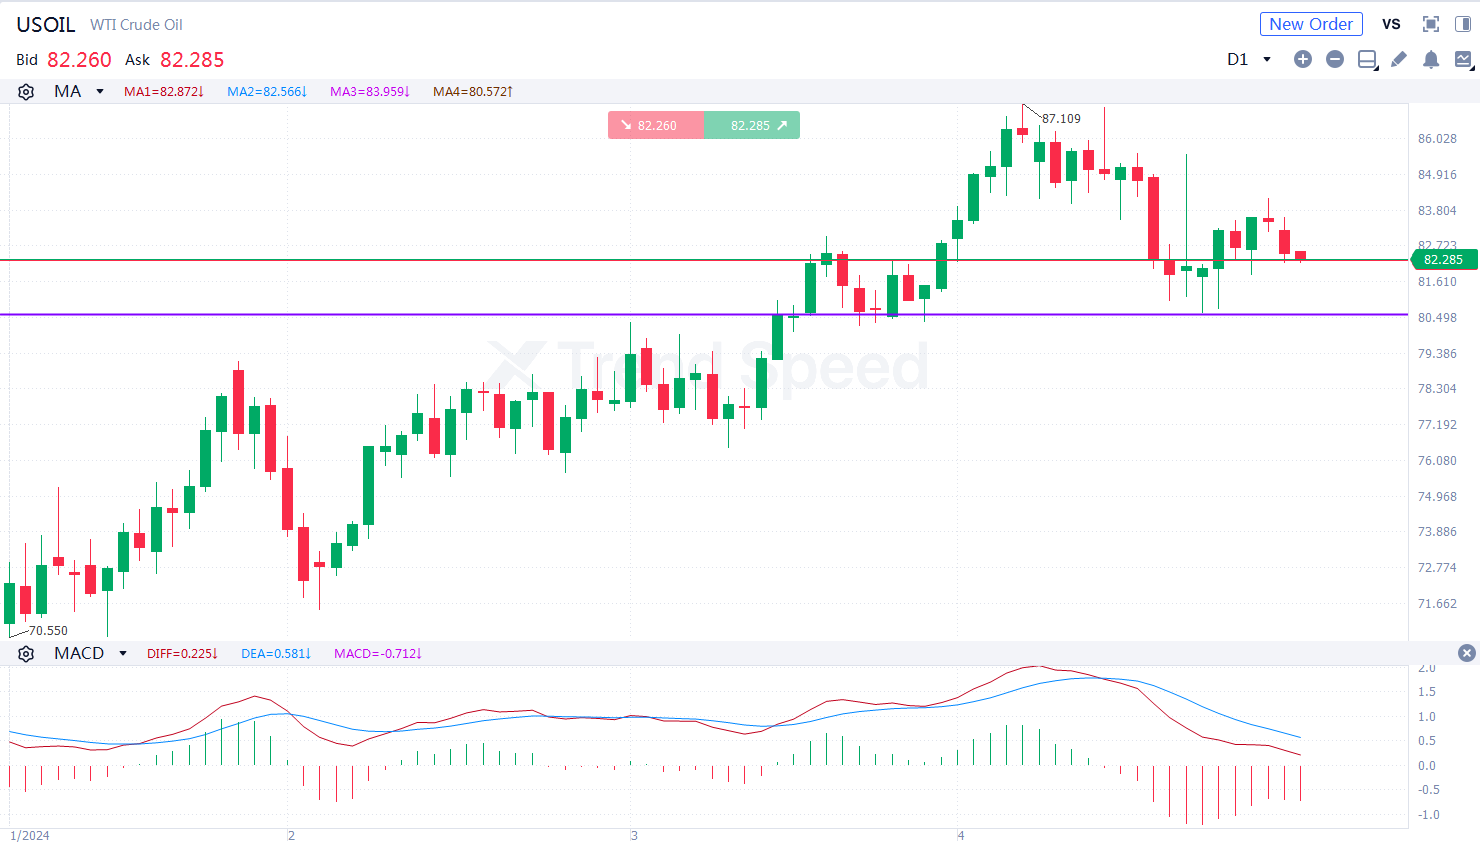
the Chart of the Day
On the chart of the day, USOIL continued falling. The bearish market trend prevailed. In terms of technical indicators, MACD went downwards after death cross occurred, showing USOIL will fall further. Investors should focus on whether USOIL will break through the support at 80.6. It will fall further with potential support at 78.3 if it breaks below 80.6.
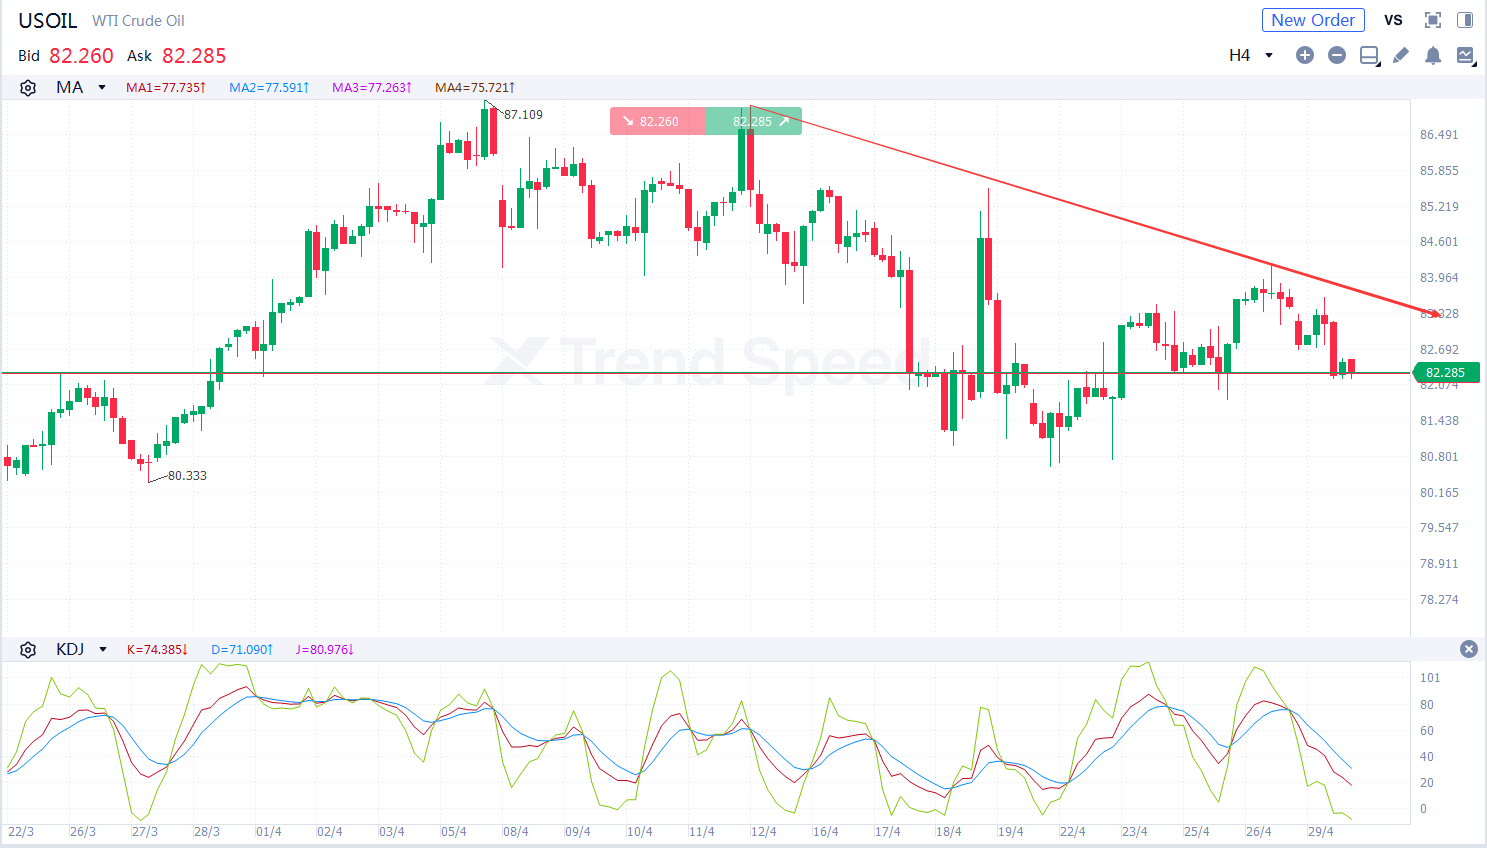
4-hour chart
On the 4-hour chart, USOIL was prone to fluctuation and declined. The bearish market trend prevailed. In terms of technical indicators, KDJ went downwards after death cross occurred, showing the market trend is bearish. Investors should focus on whether USOIL will break through the resistance at 83.2. It will fall further if it rebounds but is capped at 83.2.
Key resistance: 83.2,85.5
Key support: 80.6,78.3
Generally speaking, as many negative factors put pressure on oil price, USOIL is more likely to fall further in the short term. Investors should focus on API crude oil inventories during the day.
Hot
Technical Analysis: AUDUSD
18.03.2026
Technical Analysis: XAGUSD
17.03.2026
Technical Analysis: AUDUSD
26.03.2026
Technical Analysis: XAUUSD
19.03.2026
Technical Analysis: EURUSD
24.03.2026

Mobile Trading App
PC Trading App
Web Trading Platform

AFA REGIONAL SPONSOR
AFA REGIONAL SPONSOR
Markets
Analysis
Education
Signals
Trade
More
 Trading Central
 Argentine Football Association
 ACF Fiorentina
 Visa/Mastercard
Online trading is complex with high risks. Please invest cautiously.