

Support
Mobile Trading App
PC Trading App
Web Trading Platform
Download

Blogs About Trading
Technical Analysis: XAUUSD
30.01.2024
XAUUSD reached a one-week high
On Monday, XAUUSD was prone to fluctuation and climbed. It reached US$2037.41 at one point. It ended up 0.71% at a one-week high of US$2032.88 per ounce.
The USDX climbed and then fell
On Monday, the USDX reached the highest level since December 13 and then fell sharply. It ended up 0.01% at 103.47.
Risk aversion climbed
On Monday, as political tension escalated in the Middle East, risk aversion climbed, boosting XAUUSD.
The bullish market trend prevailed in the short term
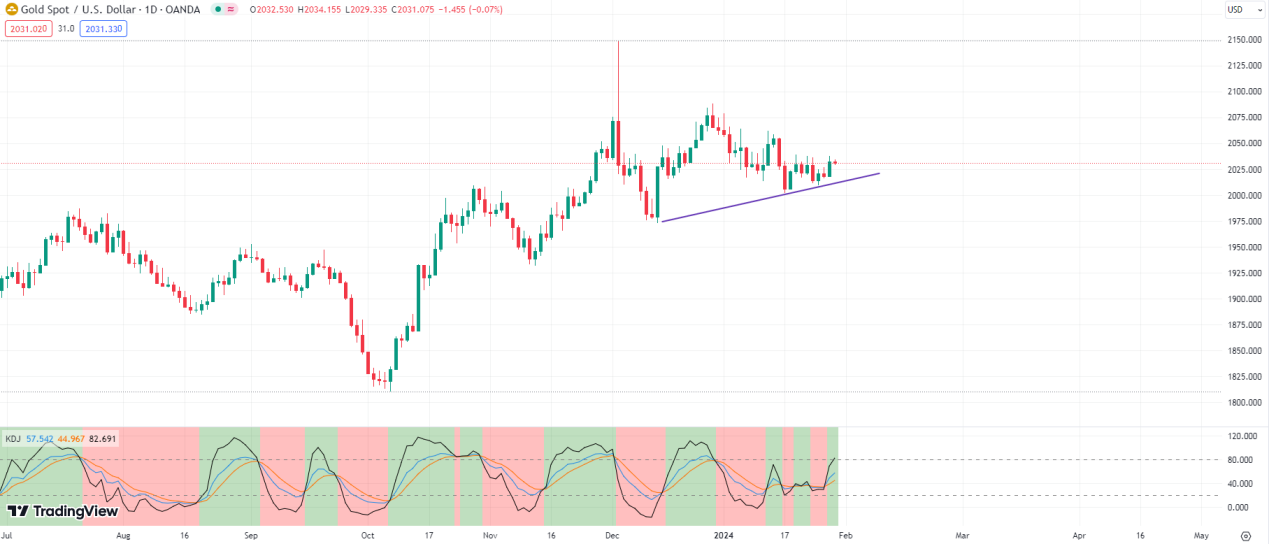
the Chart of the Day
On the chart of the day, XAUUSD increased greatly yesterday. The bullish market trend prevailed in the short term. In terms of technical indicators, KDJ went upwards after golden cross occurred, showing XAUUSD will rise further. Investors should focus on whether XAUUSD will break through the support at 2020. It will rise further if it retreats but is stable above 2020.
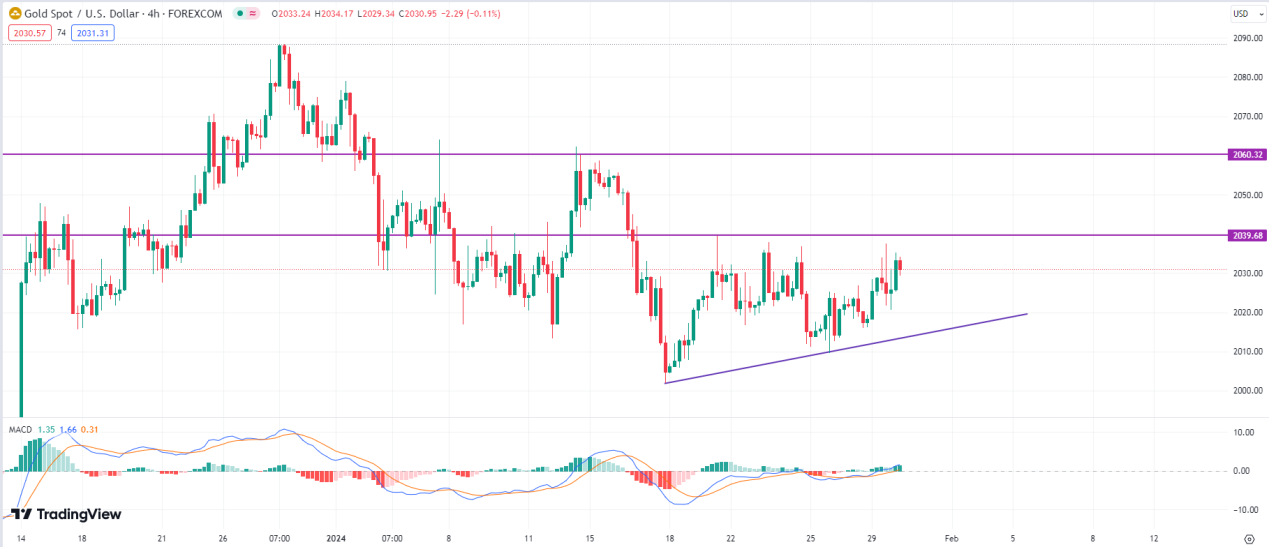
4-hour chart
On the 4-hour chart, XAUUSD was prone to fluctuation and climbed. The bullish market trend prevailed in the short term. In terms of technical indicators, MACD went upwards after golden cross occurred, showing the market trend is bullish. Investors should focus on whether XAUUSD will break through the resistance at 2040. It will rise further with potential resistance at 2060 if it breaks above the resistance at 2040.
Key resistance: 2040, 2060
Key support: 2020, 2009
Generally speaking, as risk aversion climbed, XAUUSD may rise further in the short term. Investors should focus on US economic data during the day.
Hot
Technical Analysis: AUDUSD
18.03.2026
Technical Analysis: USDJPY
25.02.2026
Technical Analysis: EURUSD
26.02.2026
Technical Analysis: USOIL
04.03.2026
Technical Analysis: XAUUSD
24.02.2026

Mobile Trading App
PC Trading App
Web Trading Platform

AFA REGIONAL SPONSOR
AFA REGIONAL SPONSOR
Markets
Analysis
Education
Signals
Trade
More
 Trading Central
 Argentine Football Association
 ACF Fiorentina
 Visa/Mastercard
Online trading is complex with high risks. Please invest cautiously.