

Support
Mobile Trading App
PC Trading App
Web Trading Platform
Download

Blogs About Trading
Technical Analysis: USOIL
25.01.2024
USOIL climbed to a one-month high
On Wednesday, USOIL increased by more than 1% to a one-month high of US$75.79 per barrel.
EIA crude oil inventories plummeted
US EIA Crude Oil Inventories (during the week ending on January 19) was -9,233 thousand barrels Vs. -2,150 thousand barrels (forecast), according to the data from the EIA. This figure reached the largest decline since August 25, 2023.
US crude oil production declined
Lowered by winter storm, US crude oil production will decrease by one million barrels per day this week, according to the EIA report on Tuesday.
Technically speaking, the bullish market trend prevailed
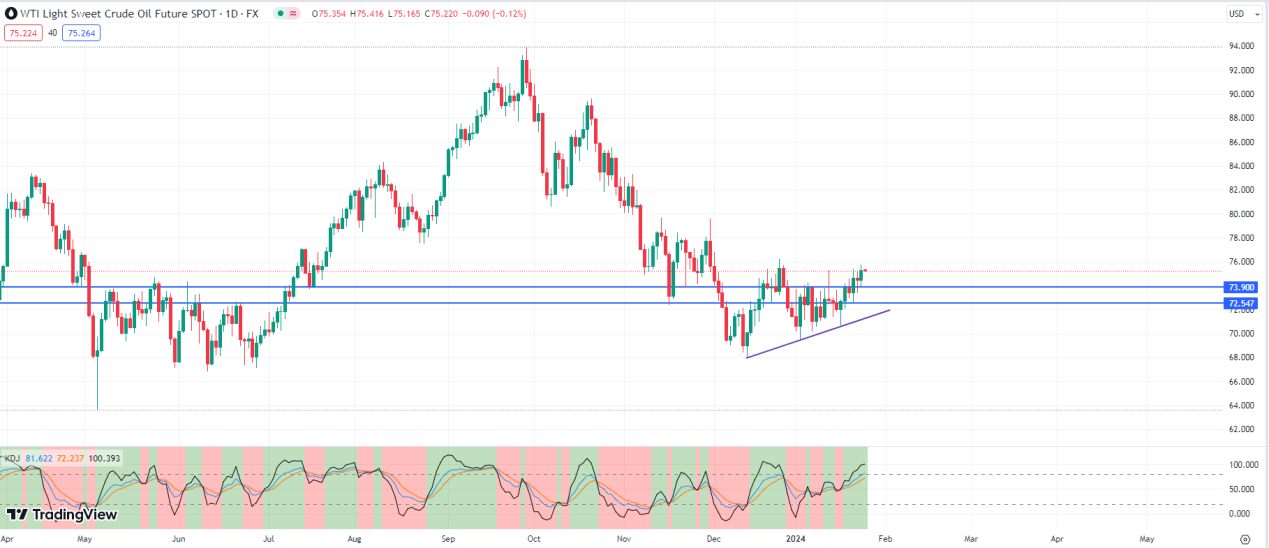
the Chart of the Day
On the chart of the day, USOIL broke above the insidebar pattern yesterday. The bullish market trend prevailed in the short term. In terms of technical indicators, KDJ went upwards after golden cross occurred, showing USOIL will rise further. USOIL will climb further if it retreats but is stable above 73.9.

4-hour Chart
On the 4-hour chart, USOIL was prone to fluctuation and climbed. The bullish market trend prevailed. In terms of technical indicators, MACD went upwards after golden cross occurred above the zero axis, showing USOIL will rise further. USOIL will climb further with potential resistance at 79.6 if it breaks above the resistance at 76.8.
Key resistance: 76.8,79.6
Key support: 73.9,72.5
Generally speaking, as EIA crude oil inventories plummeted, and US crude oil production decreased, USOIL is more likely to rise further in the short term.
Hot
Technical Analysis: USDJPY
25.02.2026
Technical Analysis: EURUSD
26.02.2026
Technical Analysis: XAUUSD
24.02.2026
Technical Analysis: USDJPY
05.03.2026
Technical Analysis: USOIL
04.03.2026

Mobile Trading App
PC Trading App
Web Trading Platform

AFA REGIONAL SPONSOR
AFA REGIONAL SPONSOR
Markets
Analysis
Education
Signals
Trade
More
 Trading Central
 Argentine Football Association
 ACF Fiorentina
 Visa/Mastercard
Online trading is complex with high risks. Please invest cautiously.