

Support
Mobile Trading App
PC Trading App
Web Trading Platform
Download

Blogs About Trading
Technical Analysis: XAUUSD
27.04.2023
XAUUSD Climbed and then Declined
On Wednesday, boosted by concerns on economic recession, XAUUSD climbed to around the US$2010 mark at one point. However, as the US treasury yield jumped, XAUUSD decreased by around US$30 to US$1983.4 per ounce. It ended down 0.39%.
US Durable Goods Orders was Strong
According to the data provided by the US Department of Labor, US Durable Goods Orders, m/m (March) increased from -1.2% to 3.2%, the highest since December 2022. It was much higher than the forecast of 0.70%.
The Expectation that the ECB will Raise the Interest Rate Rose
The ECB will hold a monetary policy meeting on May 4. As the Eurozone inflation is much higher than the goal set by the ECB, the officials at the ECB were diverged on whether the interest rate will be raised. However, the ECB is expected to continue to increase the interest rate at the May 4 meeting.
Technically speaking, XAUUSD is likely to retreat in the short term
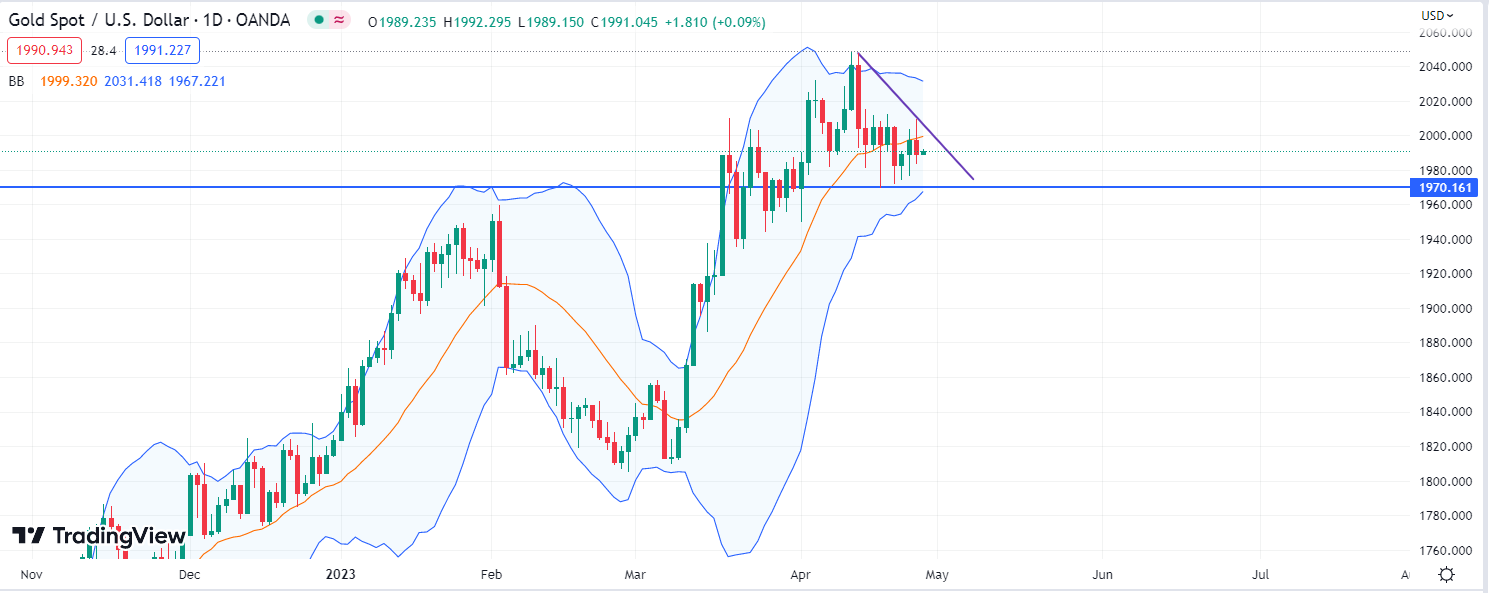
the chart of the day
On the chart of the day, XAUUSD tested the supply area and then fell yesterday. It is likely to retreat in the short term. In terms of technical indicators, XAUUSD was between the middle rail of the Bollinger Band and the bottom rail of the Bollinger Band, demonstrating that the market trend is bearish in the short term. XAUUSD will start declining if it breaks below the support at 1970.
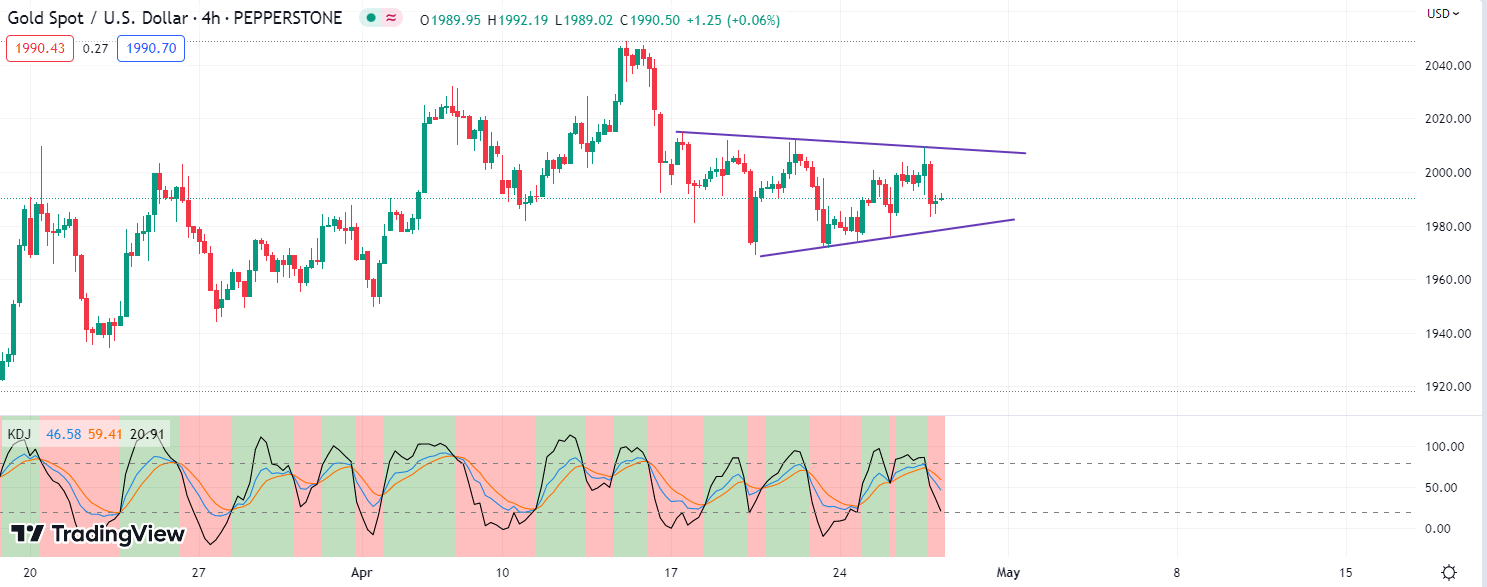
4-hour chart
On the 4-hour chart, triangle collating occurred. Investors should focus on whether XAUUSD will break through the triangle collating. In terms of technical indicators, KDJ went downwards after death cross occurred, demonstrating that XAUUSD will fall further. XAUUSD will dip further if it rebounds but is capped at the resistance at 2000.
Key resistance: 2000, 2015
Key support: 1970, 1950
Generally speaking, as the US treasury yield climbed, XAUUSD broke below the US$2000 mark. Investors should focus on US GDP, y/y (Quarter 1) and US Core PCE Price Index, y/y (Quarter 1) during the day.
Hot
Technical Analysis: AUDUSD
18.03.2026
Technical Analysis: XAGUSD
17.03.2026
Technical Analysis: GBPUSD
10.03.2026
Technical Analysis: XAUUSD
19.03.2026
Technical Analysis: EURUSD
24.03.2026

Mobile Trading App
PC Trading App
Web Trading Platform

AFA REGIONAL SPONSOR
AFA REGIONAL SPONSOR
Markets
Analysis
Education
Signals
Trade
More
 Trading Central
 Argentine Football Association
 ACF Fiorentina
 Visa/Mastercard
Online trading is complex with high risks. Please invest cautiously.