Support
Mobile Trading App
PC Trading App
Web Trading Platform
Download

Blogs About Trading
Technical Analysis: USDJPY
21.03.2023
USDJPY reached a 1-month low
On Monday, as the US dollar fell, USDJPY continued falling, and reached a one-month low of 130.54.
The BOJ maintained loose monetary policies
The BOJ (Bank of Japan) announced its comments on March monetary policies on 20th March. At the March meeting, the BOJ kept the policy interest rate and the 10-year government bond yield unchanged at -0.1% and 0% respectively, and maintained forward guidance on the interest rate, meeting expectations.
The US dollar decreased to a one-month low
On Monday, the US dollar decreased by 0.4%, and reached 103.27 at one point, the lowest since 15th February. Risk aversion eased after the UBS purchased the Credit Suisse at a low price, putting pressure on the US dollar.
Technically speaking, the market trend is bearish

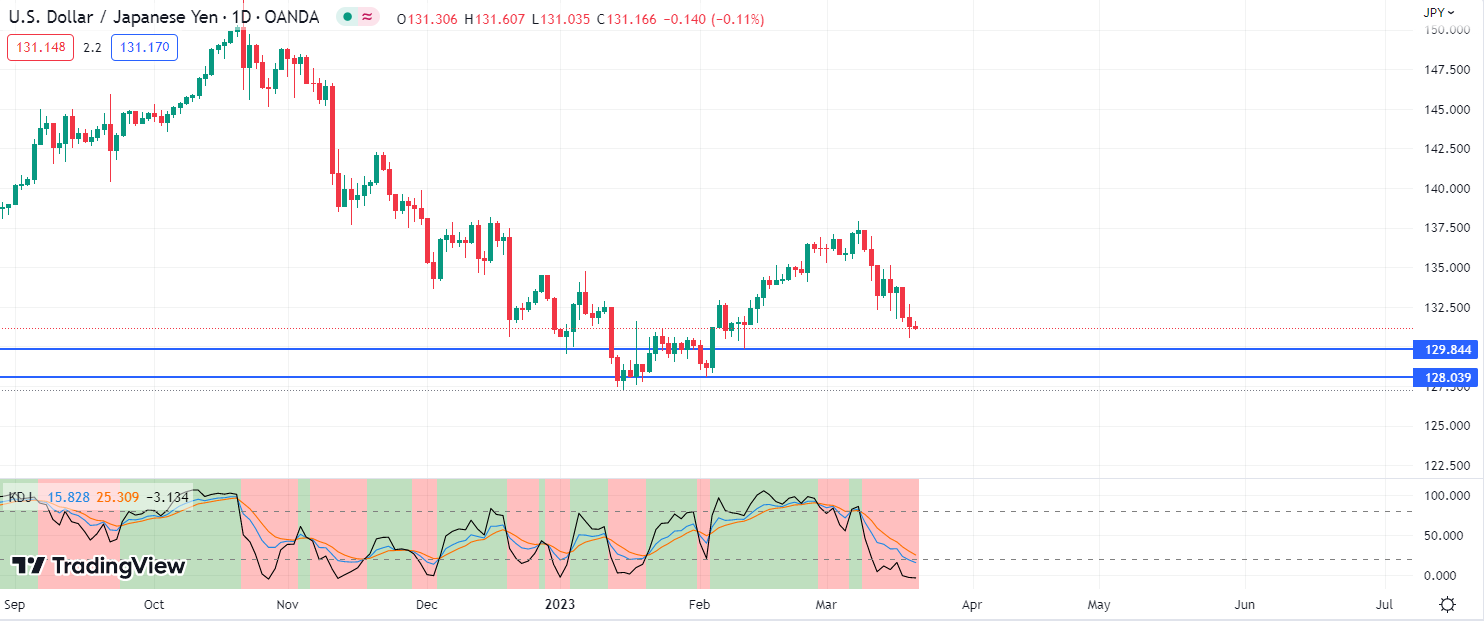
the chart of the day
On the chart of the day, USDJPY continued falling. The market trend is bearish in the short term. In terms of technical indicators, KDJ went downwards after death cross occurred, demonstrating that USDJPY will fall further. If USDJPY continues falling, investors should focus on whether it will break through the support at 129.8.

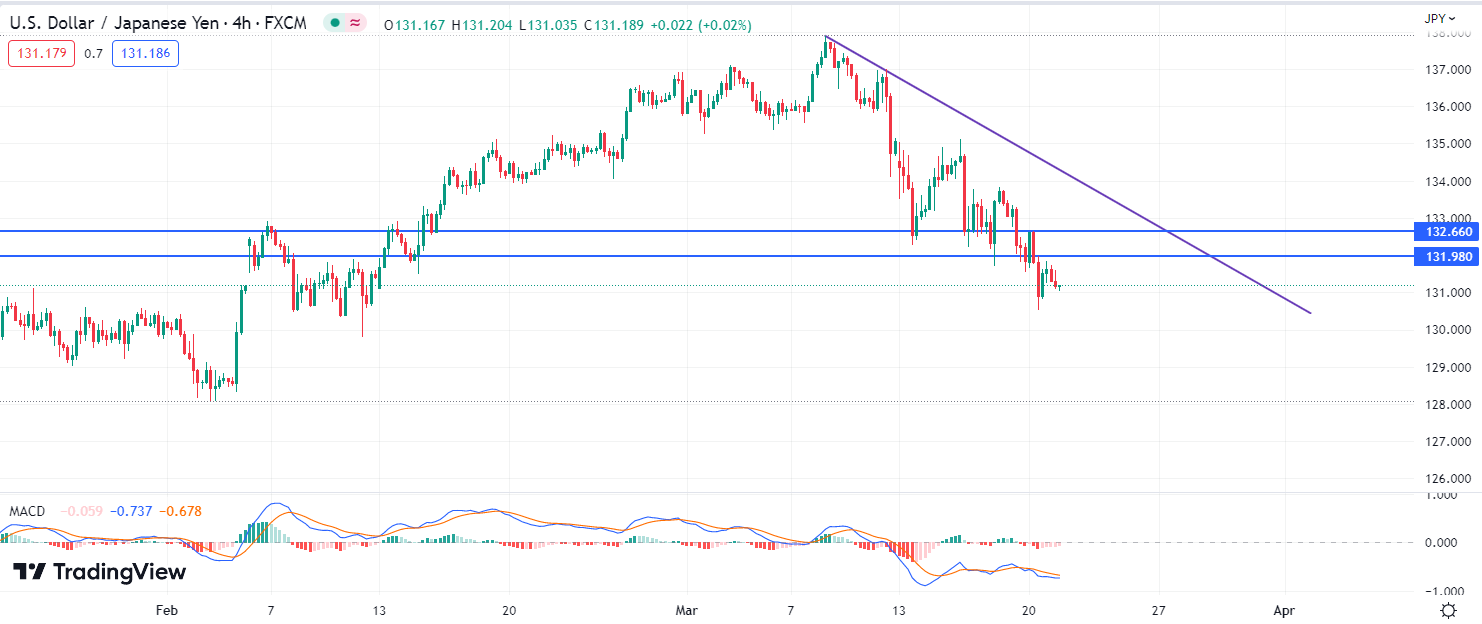
4-hour chart
On the 4-hour chart, USDJPY was prone to fluctuation and decreased. The market trend is bearish. In terms of technical indicators, MACD went downwards after death cross occurred, demonstrating that bearish market trend prevailed. Investors could sell if USDJPY rebounds but is capped at the resistance at 132.0.
Key resistance: 132.0, 132.6
Key support: 129.8, 128.0
Generally speaking, as the US dollar index fell, there is a risk that USDJPY will fall further in the short term.
Hot
Technical Analysis: USDJPY
05.02.2026
Technical Analysis: XAUUSD
28.01.2026
Technical Analysis: EURUSD
03.02.2026
Technical Analysis: AUDUSD
10.02.2026
Technical Analysis: USOIL
29.01.2026


