

Support
Mobile Trading App
PC Trading App
Web Trading Platform
Download

Blogs About Trading
Technical Analysis: GBPUSD
17.09.2025
GBPUSD reached a two-month high
On Tuesday, GBPUSD continued rising. At one point, it reached a two-month high of 1.3671.
The USDX fell to a ten-week low
On Tuesday, as the Fed was expected to cut the interest rate, the USDX fell to a ten-week low. It ended down 0.71% at 96.65.
UK unemployment rate met expectations
UK ILO Unemployment Rate (during the three months ending in July) was kept unchanged at 4.7%, meeting market expectations, according to the data from the ONS (Office for National Statistics).
The bullish market trend prevailed
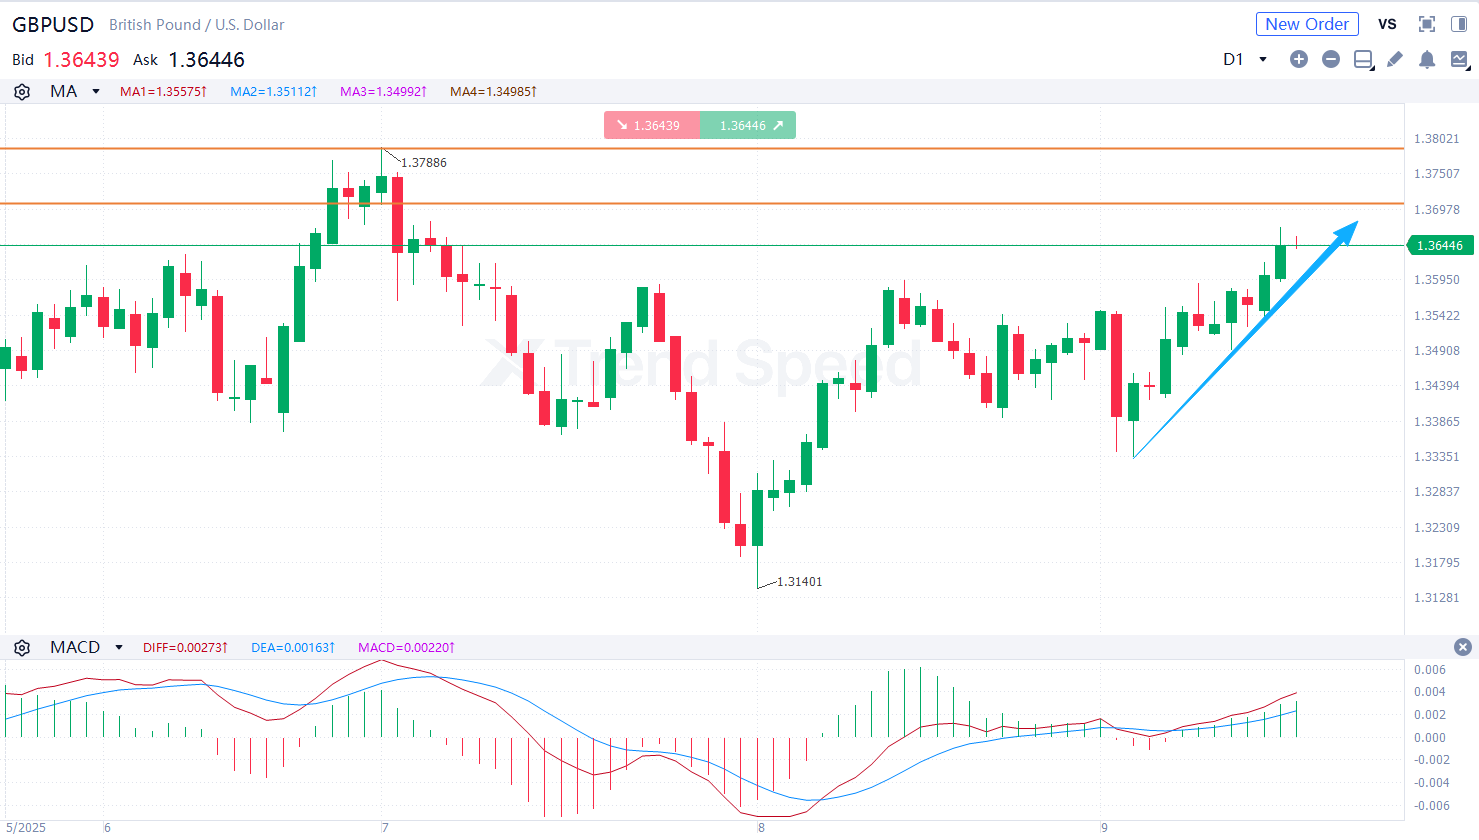 the Chart of the Day
On the chart of the day, GBPUSD was prone to fluctuation and climbed. The bullish market trend prevailed. In terms of technical indicators, MACD went upwards after golden cross occurred, showing that GBPUSD will rise further. Investors should focus on whether GBPUSD will break through the resistance at 1.370. It will jump with potential resistance at 1.379 if it breaks above 1.370.
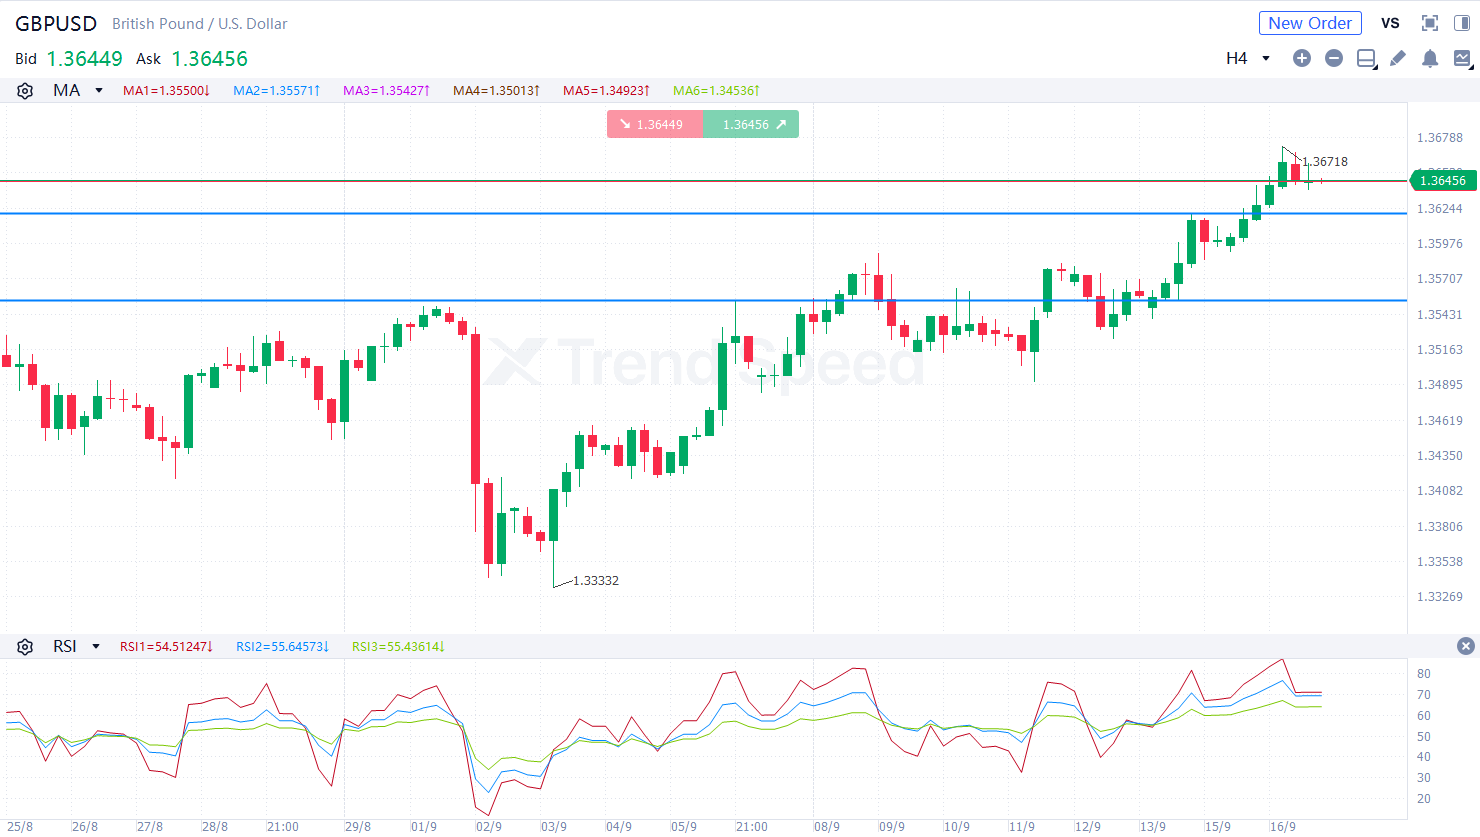 4-hour chart
On the 4-hour chart, GBPUSD was prone to fluctuation and climbed in the short term. The bullish market trend prevailed. In terms of technical indicators, RSI went upwards after golden cross occurred, showing that the market trend is bullish. Investors should focus on whether GBPUSD will break through the support at 1.362. It will climb if it retreats but is stable above 1.362.
Key resistance: 1.370,1.379
Key support: 1.362,1.355
Generally speaking, the bullish market trend prevailed in the short term. Investors should focus on the Fed interest rate decision during the day.
Hot
Technical Analysis: AUDUSD
11.09.2025
Technical Analysis: AUDUSD
28.08.2025
Technical Analysis: XAUUSD
09.09.2025
Technical Analysis: GBPUSD
17.09.2025
Technical Analysis: USOIL
04.09.2025

Mobile Trading App
PC Trading App
Web Trading Platform

AFA REGIONAL SPONSOR
AFA REGIONAL SPONSOR
Markets
Analysis
Education
Signals
Trade
More
 Trading Central
 Argentine Football Association
 ACF Fiorentina
 Visa/Mastercard
Online trading is complex with high risks. Please invest cautiously.