

Support
Mobile Trading App
PC Trading App
Web Trading Platform
Download

Blogs About Trading
Technical Analysis: XAUUSD
16.09.2025
XAUUSD reached a record high again
On Monday, XAUUSD increased by more than 1% and broke above the US$3680 mark, setting a record high again.
The USDX was capped
On Monday, as the Fed was expected to cut the interest rate, the USDX continued falling. It ended down 0.28% at 97.34.
Gold ETF holdings increased
As of 15th September, gold holdings reached 976.81 tons, increasing by 2.01 tons compared to the data on 14th September, according to the data from the world’s largest gold ETF--SPDR Gold Trust.
The bullish market trend prevailed
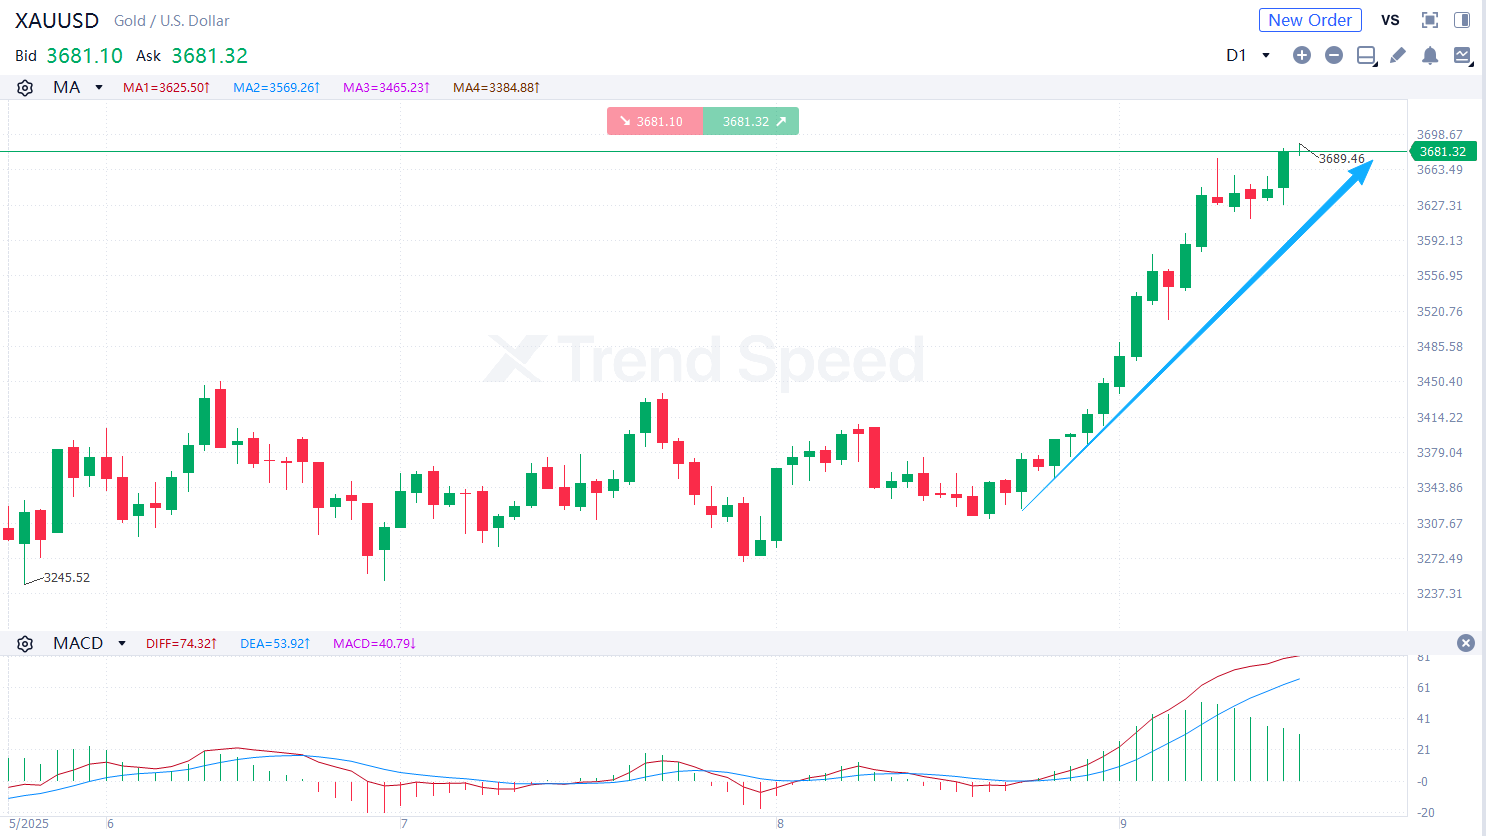 the Chart of the Day
On the chart of the day, XAUUSD was prone to fluctuation and climbed. The bullish market trend prevailed. In terms of technical indicators, MACD went upwards after golden cross occurred, showing that XAUUSD will rise further. Investors should focus on whether XAUUSD will break through the resistance at 3700. It will jump with potential resistance at 3750 if it breaks above 3700.
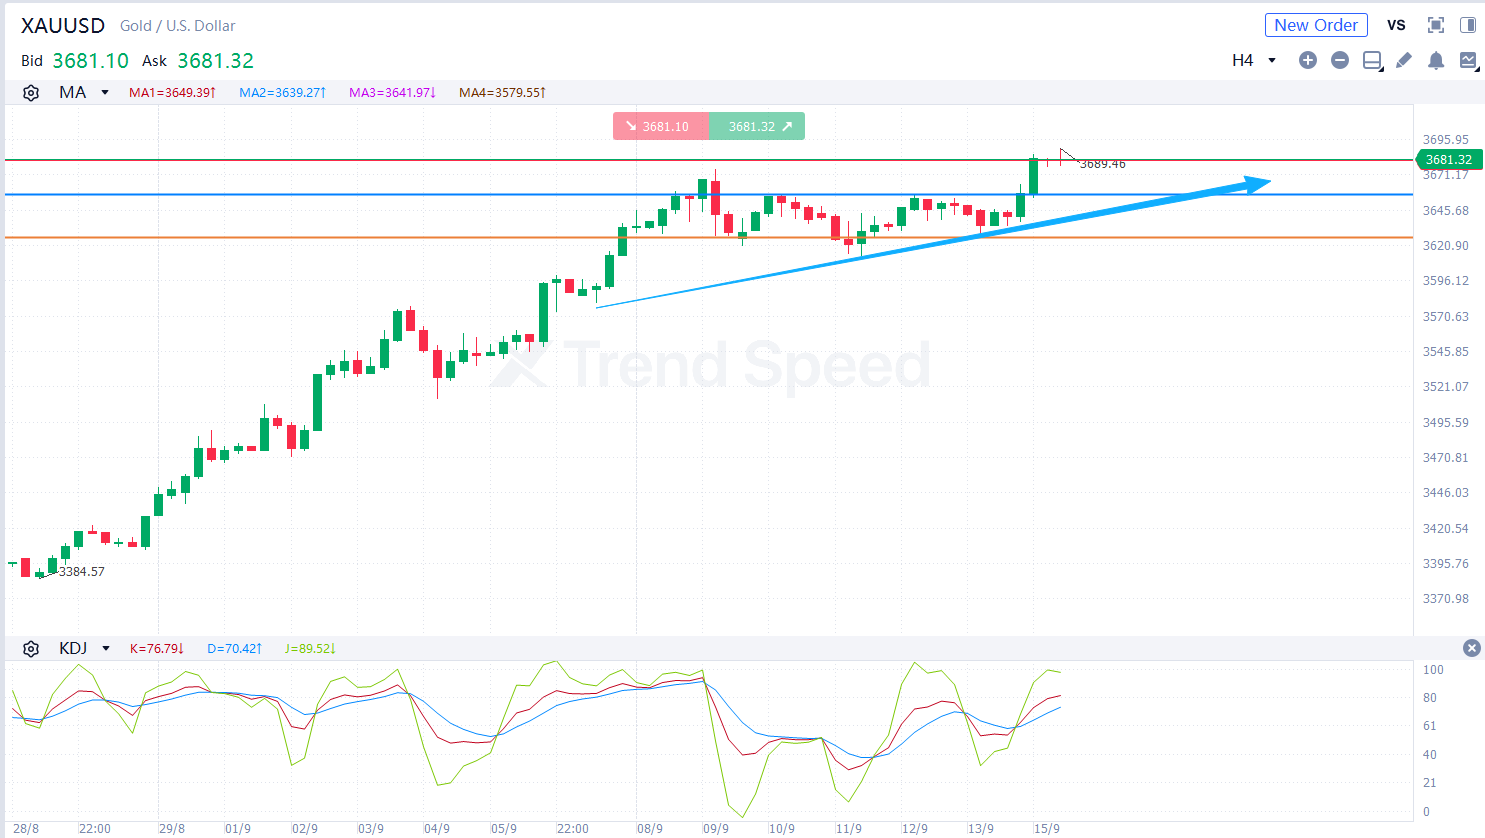 4-hour chart
On the 4-hour chart, XAUUSD was prone to fluctuation and climbed in the short term. The bullish market trend prevailed. In terms of technical indicators, KDJ went upwards after golden cross occurred, showing that the market trend is bullish. Investors should focus on whether XAUUSD will break through the support at 3656. It will rise further if it retreats but is stable above 3656.
Key resistance: 3700,3750
Key support: 3656,3626
Generally speaking, the bullish market trend prevailed in the short term. Investors should focus US Retail Sales, m/m (August) during the day.
Hot
Technical Analysis: AUDUSD
11.09.2025
Technical Analysis: GBPUSD
17.09.2025
Technical Analysis: USDCAD
18.09.2025
Technical Analysis: XAUUSD
16.09.2025
Technical Analysis: GBPUSD
25.09.2025

Mobile Trading App
PC Trading App
Web Trading Platform

AFA REGIONAL SPONSOR
AFA REGIONAL SPONSOR
Markets
Analysis
Education
Signals
Trade
More
 Trading Central
 Argentine Football Association
 ACF Fiorentina
 Visa/Mastercard
Online trading is complex with high risks. Please invest cautiously.