

Support
Mobile Trading App
PC Trading App
Web Trading Platform
Download

Blogs About Trading
Technical Analysis: XAUUSD
26.08.2025
XAUUSD hit a two-week high
On Tuesday, in Asian session, XAUUSD climbed steadily. At one point, It broke above the US$3380 mark to the highest level since 11th August.
The USDX rebounded steadily
On Monday, the USDX rebounded steadily, and broke above the 98 mark again. It ended up 0.71% at 98.39.
Gold ETF holdings increased
As of 25th August, gold ETF holdings increased by 1.72 tons to 958.49 tons, according to the data from the world’s largest ETF —— SPDR Gold Trust.
The bullish market trend prevailed in the short term
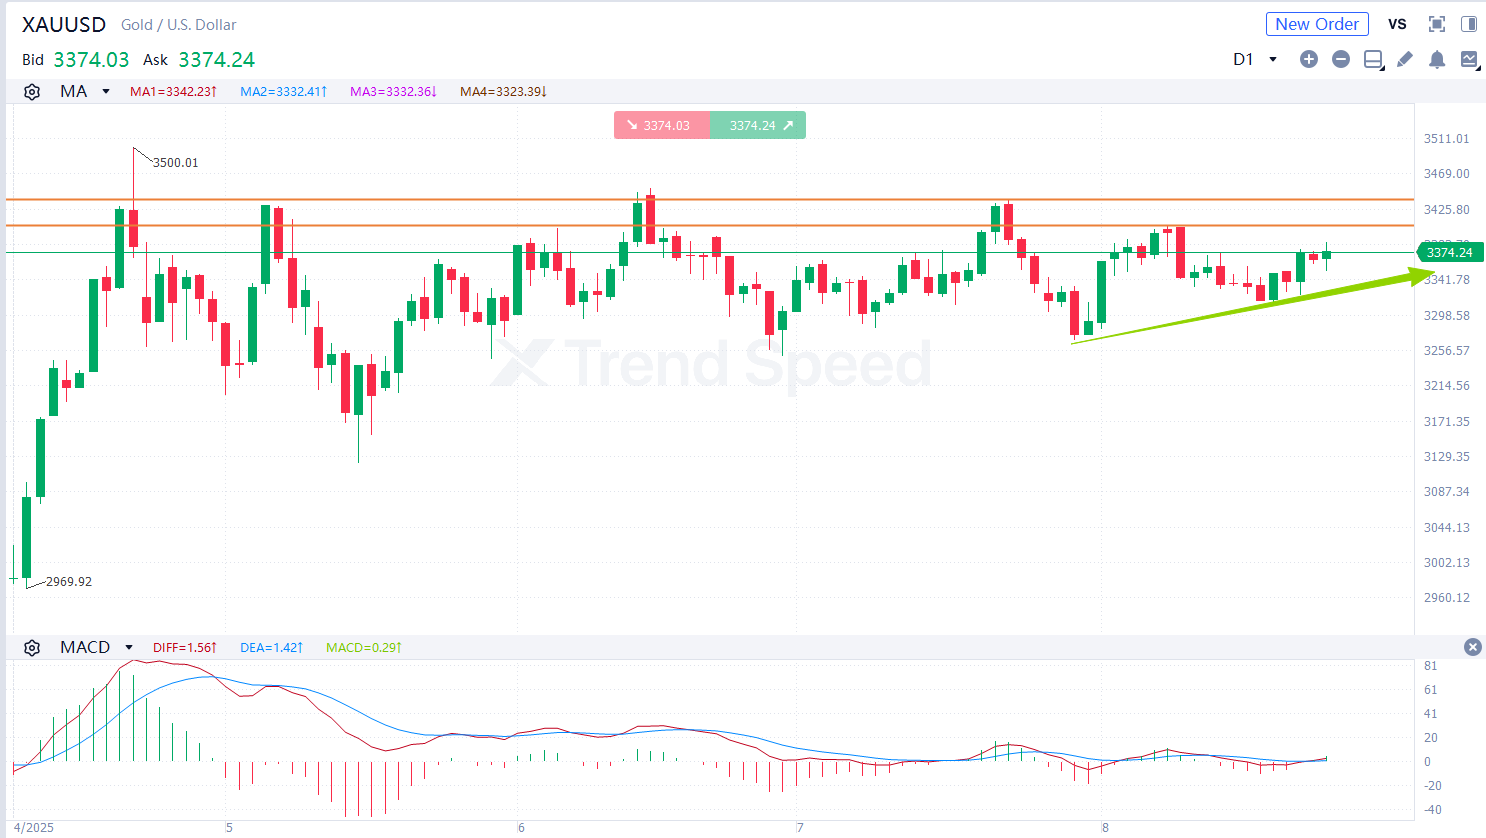 the Chart of the Day
On the chart of the day, XAUUSD was prone to fluctuation and climbed in the short term. The bullish market trend prevailed. In terms of technical indicators, MACD went upwards after golden cross occurred, showing that XAUUSD will rise further. Investors should focus on whether XAUUSD will break through the resistance at 3408. It will jump with potential resistance at 3439 if it breaks above 3408.
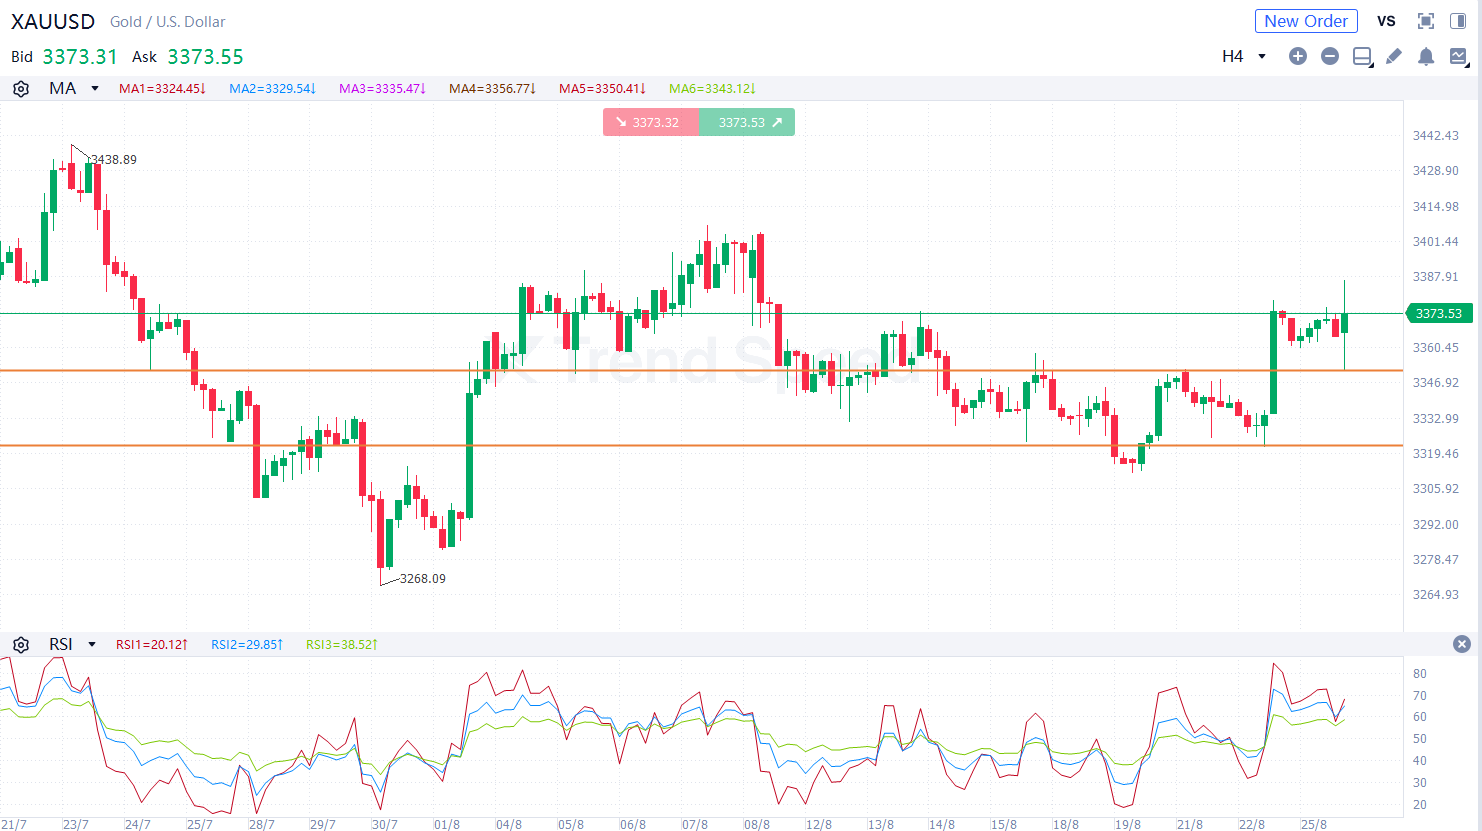 4-hour chart
On the 4-hour chart, XAUUSD increased steadily. The bullish market trend prevailed in the short term. In terms of technical indicators, RSI went upwards after golden cross occurred, showing that the bullish market trend prevailed. Investors should focus on whether XAUUSD will break through the support at 3351. It will rise if it retreats but is stable above 3351.
Key resistance: 3408, 3439
Key support: 3351, 3321
Generally speaking, the bullish market trend prevailed in the short term. Investors should focus on US economic data during the day.
Hot
Technical Analysis: XAUUSD
12.08.2025
Technical Analysis: AUDUSD
28.08.2025
Technical Analysis: USOIL
04.09.2025
Technical Analysis: XAUUSD
26.08.2025
Technical Analysis: USOIL
27.08.2025

Mobile Trading App
PC Trading App
Web Trading Platform

AFA REGIONAL SPONSOR
AFA REGIONAL SPONSOR
Markets
Analysis
Education
Signals
Trade
More
 Trading Central
 Argentine Football Association
 ACF Fiorentina
 Visa/Mastercard
Online trading is complex with high risks. Please invest cautiously.