

Support
Mobile Trading App
PC Trading App
Web Trading Platform
Download

Blogs About Trading
Technical Analysis: USOIL
04.06.2025
USOIL climbed for two consecutive days
On Tuesday, USOIL climbed for two consecutive trading days. It ended up 0.43% at US$63.60 per barrel.
Geopolitical tension supported oil prices
Continued geopolitical tension between Russia and Ukraine, America and Iran supported oil prices this week.
US API crude oil inventories decreased
US API crude oil inventories (during the week ending on 30th May) increased from -4,236 thousand barrels to -3,300 thousand barrels Vs. -900 thousand barrels (forecast).
The bullish market trend prevailed in the short term
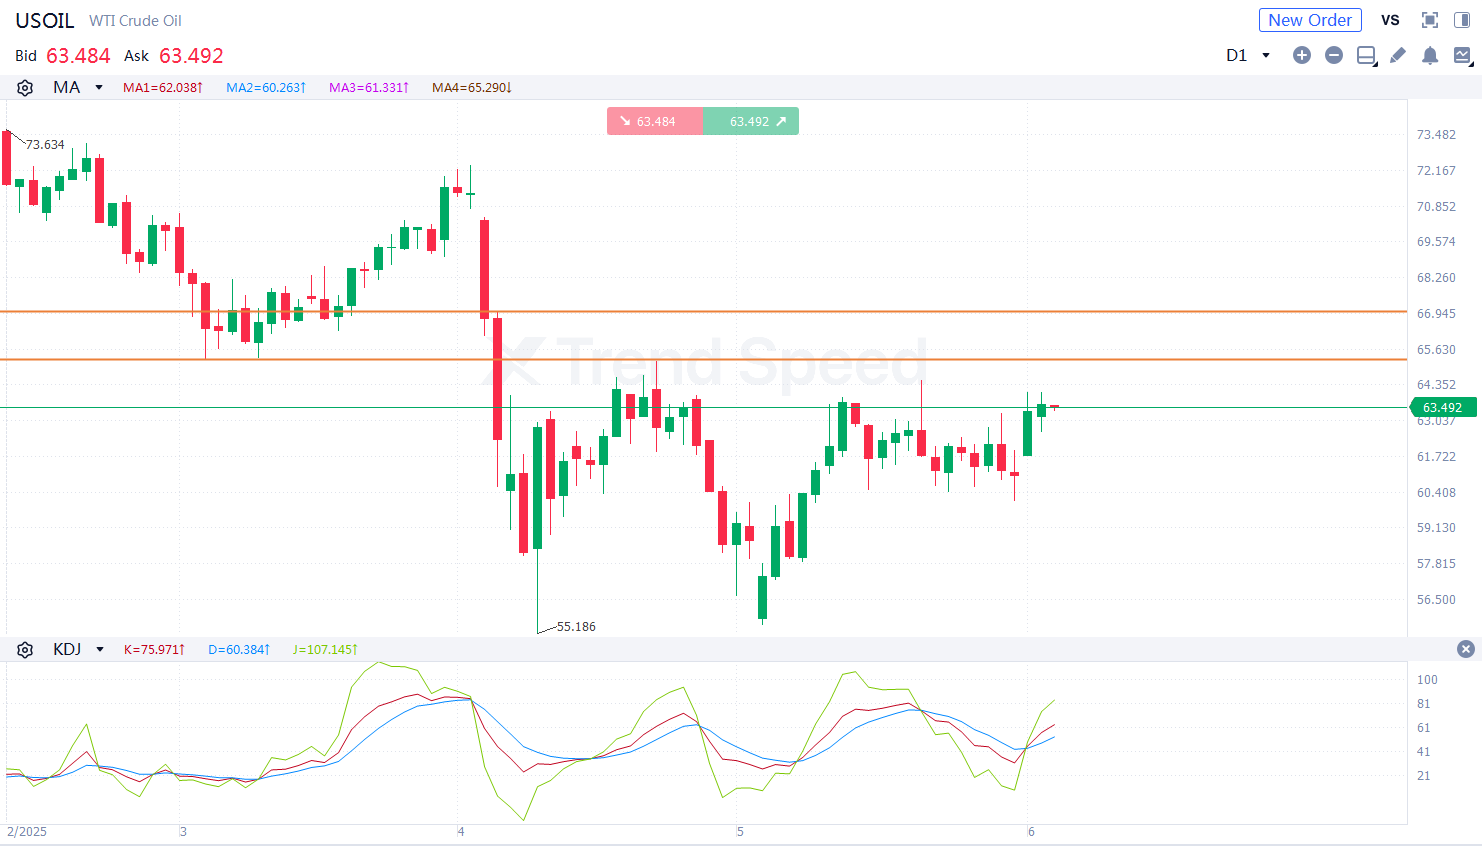
the Chart of the Day
On the chart of the day, USOIL climbed steadily. The bullish market trend prevailed in the short term. In terms of technical indicators, KDJ went upwards after golden cross occurred, showing that USOIL will continue rising. Investors should focus on whether USOIL will break through the resistance at 65.2. It will rise further with potential resistance at 67.0 if it breaks above 65.2.
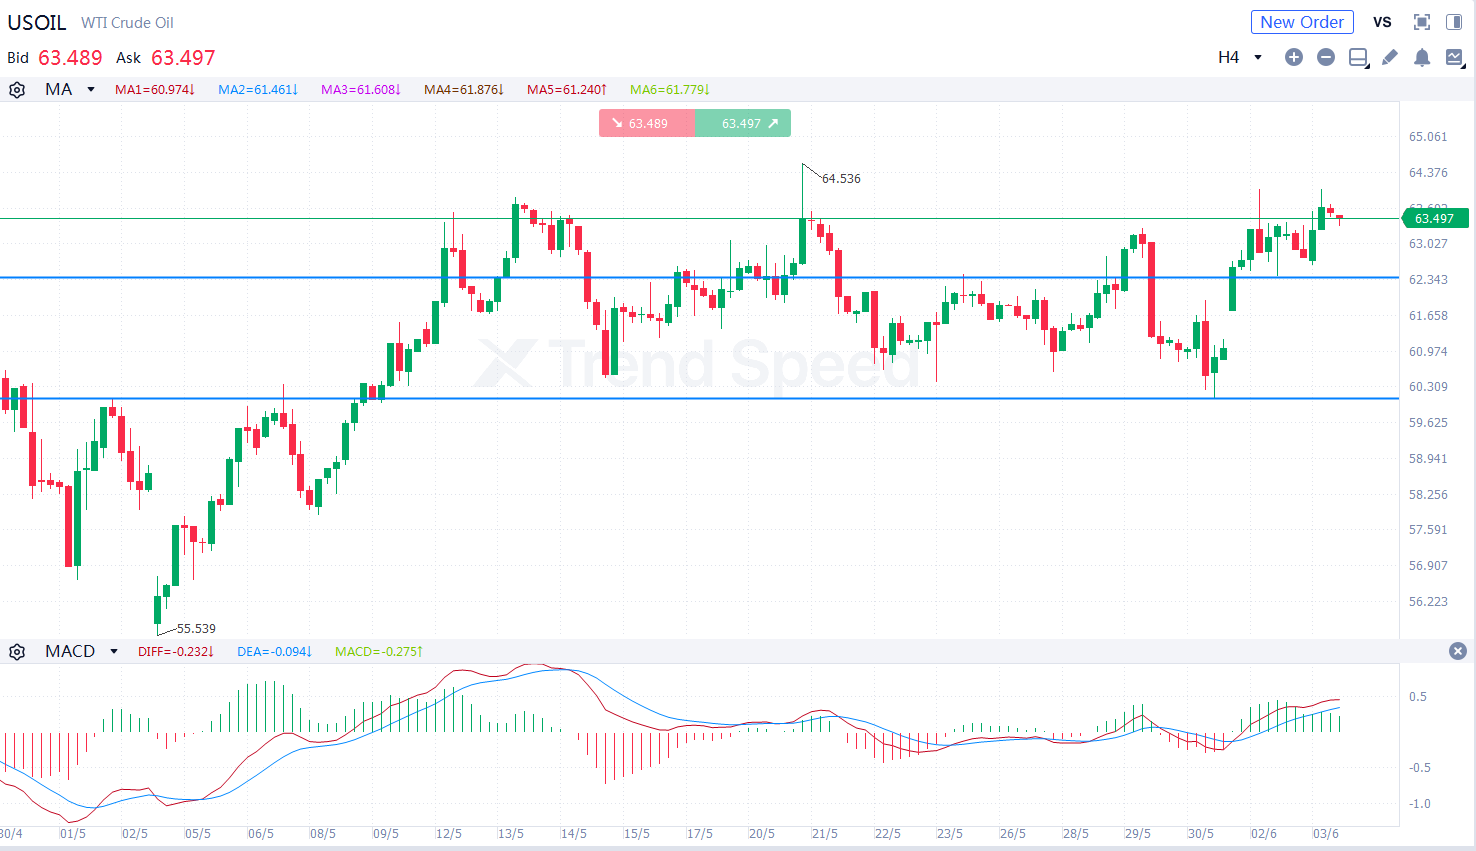
4-hour chart
On the 4-hour chart, USOIL was prone to fluctuation and climbed. The bullish market trend prevailed. In terms of technical indicators, MACD went upwards after golden cross occurred, showing that the market trend is bullish. Investors should focus on whether USOIL will break through the support at 62.4. It will rise further if it retreats but is stable above 62.4.
Key resistance: 65.2,67.0
Key support: 62.4,60.0
Generally speaking, the bullish market trend prevailed in the short term. Investors should focus on US EIA Crude Oil Inventories during the day.
Hot
Technical Analysis: USDCAD
05.06.2025
Technical Analysis: GBPUSD
19.06.2025
Technical Analysis: XAUUSD
12.06.2025
Technical Analysis: XAUUSD
17.06.2025
Technical Analysis: USOIL
10.06.2025

Mobile Trading App
PC Trading App
Web Trading Platform

AFA REGIONAL SPONSOR
AFA REGIONAL SPONSOR
Markets
Analysis
Education
Signals
Trade
More
 Trading Central
 Argentine Football Association
 ACF Fiorentina
 Visa/Mastercard
Online trading is complex with high risks. Please invest cautiously.