

Support
Mobile Trading App
PC Trading App
Web Trading Platform
Download

Blogs About Trading
Technical Analysis: USOIL
29.05.2025
USOIL climbed to a one-week high
On Wednesday, US rebounded steadily and climbed to the highest level since 21st May. It ended up 1.33% at US$62.15 per barrel.
OPEC+ agreed to leave oil production policies where they were
On Wednesday, OPEC+ held a minister-level meeting and decided to leave oil production policies where they were. In addition, OPEC+ agreed to make 2025 oil production as the benchmark for 2027.
US API crude oil inventories decreased
US API Crude Oil Inventories (during the week ending on the 23rd May) fell from 2,499 thousand barrels to -4,236 thousand barrels Vs. 509 thousand barrels (forecast), according to the data from the API.
The bullish market trend prevailed in the short term
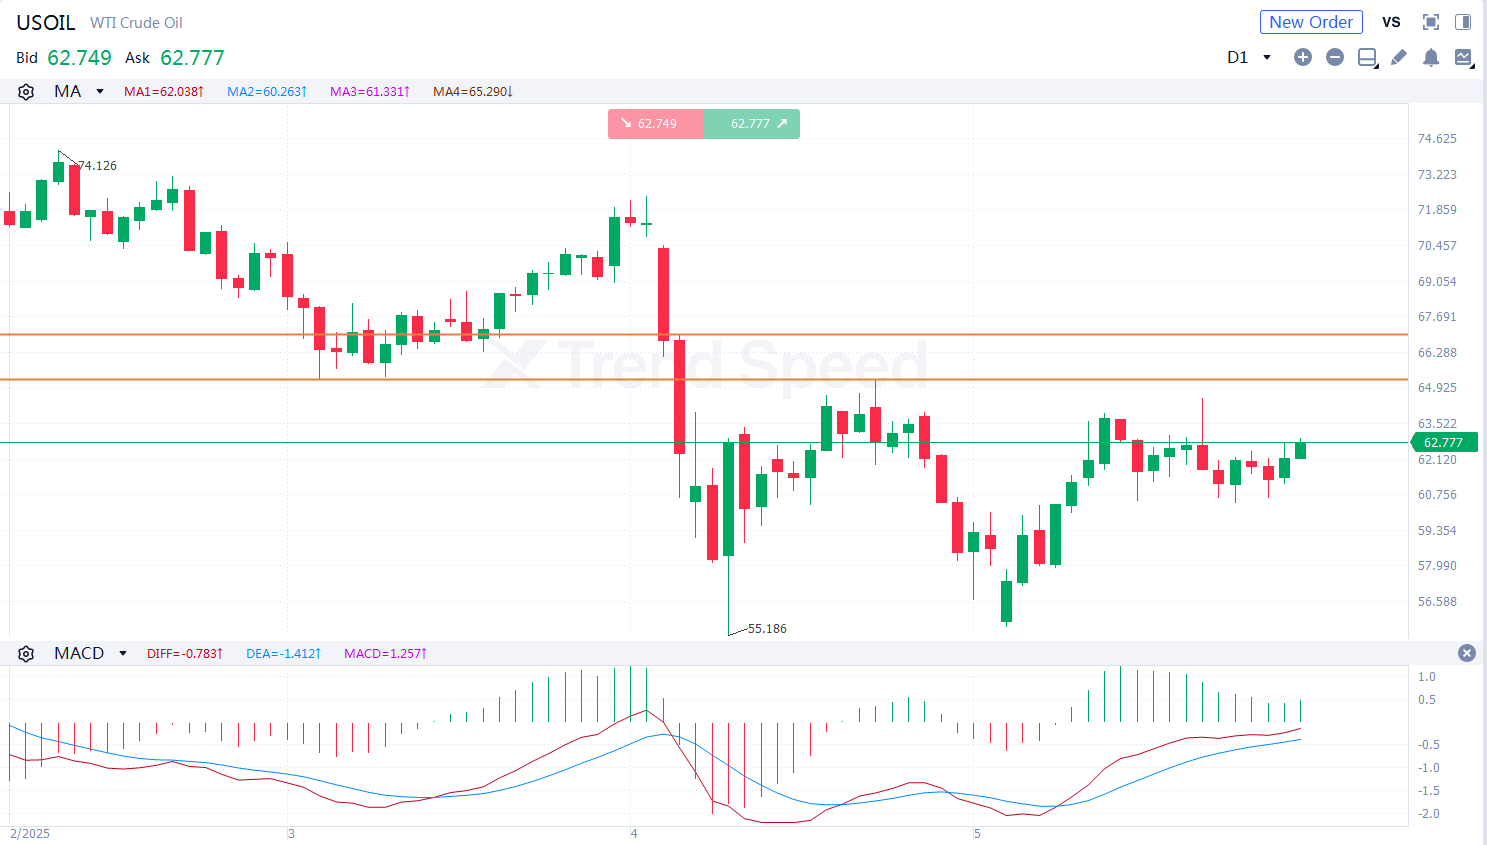
the Chart of the Day
On the chart of the day, USOIL rose steadily. The bullish market trend prevailed in the short term. In terms of technical indicators, MACD went upwards after golden cross occurred, showing that USOIL will jump further. Investors should focus on whether USOIL will break through the resistance at 65.2. It will rise further with potential resistance at 67.0 if it breaks above 65.2.
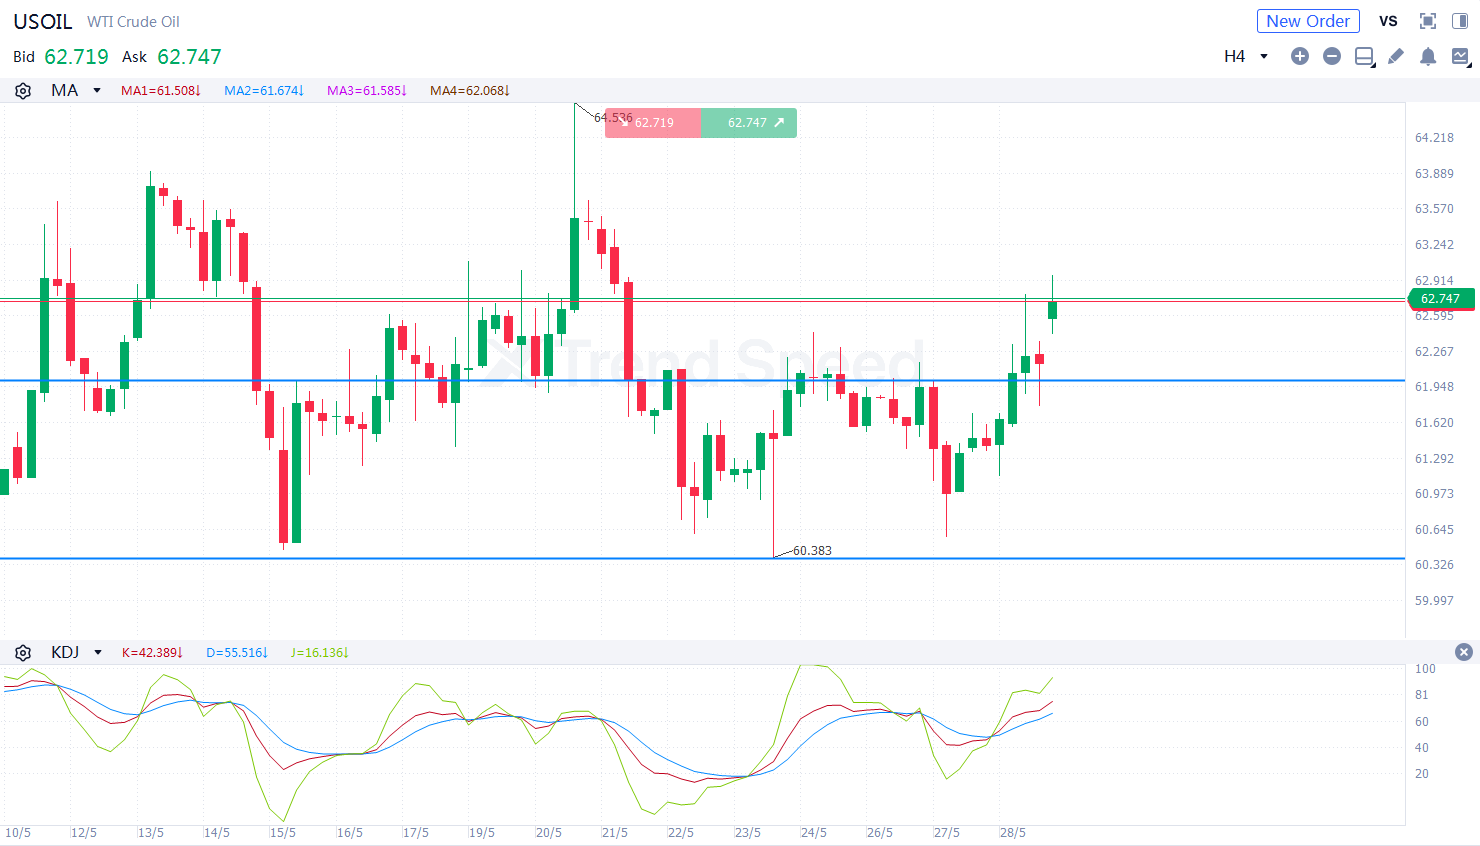
4-hour chart
On the 4-hour chart, USOIL was prone to fluctuation and climbed. The bullish market trend prevailed. In terms of technical indicators, KDJ went upwards after golden cross occurred, showing that the market trend is bullish. Investors should focus on whether USOIL will break through the support at 62.0. It will rise further if it retreats but is stable above 62.0.
Key resistance: 65.2,67.0
Key support: 62.0,60.4
Generally speaking, the bullish market trend prevailed in the short term. Investors should focus on US EIA crude oil inventories during the day.
Hot
Technical Analysis: XAUUSD
03.06.2025
Technical Analysis: XAGUSD
15.05.2025
Technical Analysis: USOIL
29.05.2025
Technical Analysis: EURUSD
20.05.2025
Technical Analysis: GBPUSD
22.05.2025

Mobile Trading App
PC Trading App
Web Trading Platform

AFA REGIONAL SPONSOR
AFA REGIONAL SPONSOR
Markets
Analysis
Education
Signals
Trade
More
 Trading Central
 Argentine Football Association
 ACF Fiorentina
 Visa/Mastercard
Online trading is complex with high risks. Please invest cautiously.