

Support
Mobile Trading App
PC Trading App
Web Trading Platform
Download

Blogs About Trading
Technical Analysis: GBPUSD
22.05.2025
GBPUSD hit a 3-year high
On Wednesday, GBPUSD continued rising. It reached 1.3468 at one point, which marked the highest level since February 2022.
The USDX broke below the 100 mark
On Wednesday, lowered by concerns on Trump’s tax cut bill and budget bill, the USDX continued falling and broke below the 100 mark. It ended down 0.42% at 99.60.
UK inflation climbed
UK CPI, y/y (April) rose from 2.6% to 3.5% Vs. 3.3% (forecast), according to the data from the Office for National Statistics. In addition, UK CPI, m/m (April) jumped from 0.3% to 1.2% Vs. 1.1% (forecast).
Technically speaking, the bullish market trend prevailed in the short term
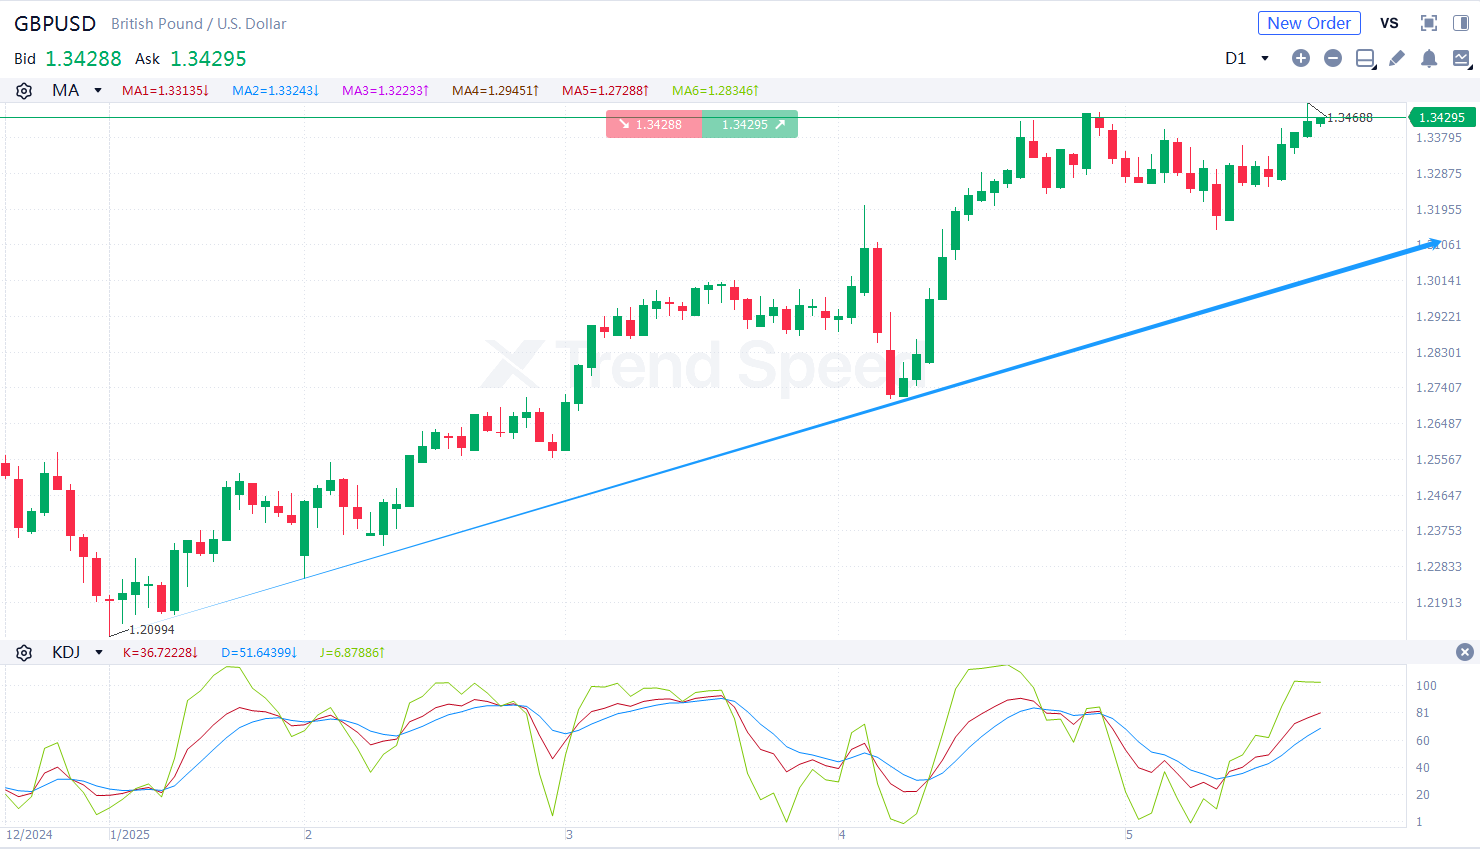
the Chart of the Day
On the chart of the day, GBPUSD continued rising. The bullish market trend prevailed in the short term. In terms of technical indicators, KDJ went upwards after golden cross occurred, showing that GBPUSD will rise further. Investors should focus on whether GBPUSD will break through the resistance at 1.350. It will climb further with potential resistance at 1.364 if it breaks above 1.350.
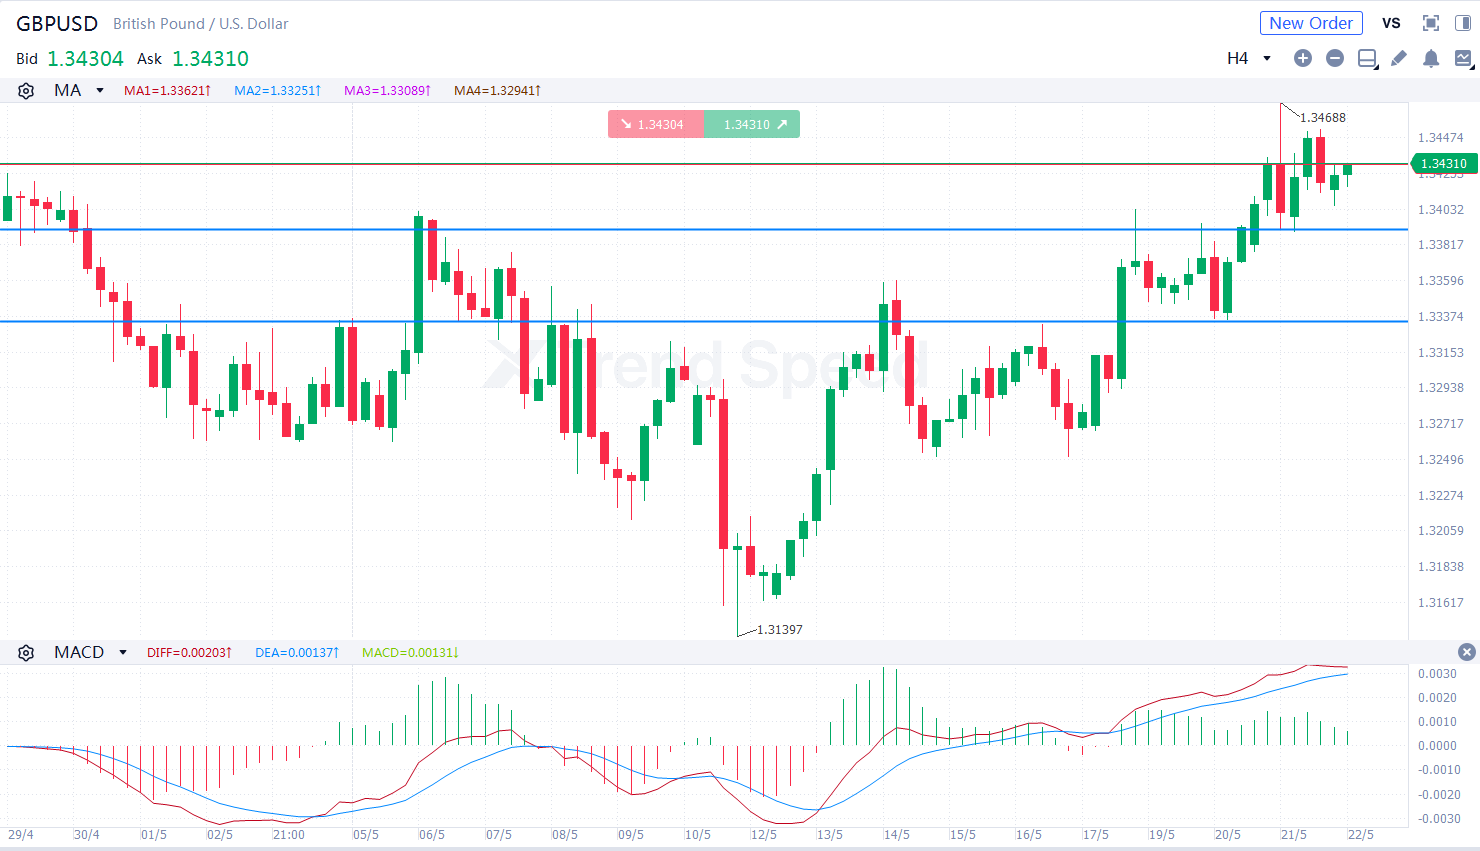
4-hour chart
On the 4-hour chart, GBPUSD was prone to fluctuation and climbed. The bullish market trend prevailed. In terms of technical indicators, MACD went upwards after golden cross occurred, showing that the market trend is bullish. Investors should focus on whether GBPUSD will break through the support at 1.339. It will climb further if it retreats but is stable above 1.339.
Key resistance: 1.350,1.364
Key support: 1.339,1.333
Generally speaking, GBPUSD is more likely to rise further in the short term. Investors should focus on UK economic data during the day.
Hot
Technical Analysis: USDJPY
08.05.2025
Technical Analysis: XAGUSD
15.05.2025
Technical Analysis: EURUSD
20.05.2025
Technical Analysis: GBPUSD
22.05.2025
Technical Analysis: XAUUSD
03.06.2025

Mobile Trading App
PC Trading App
Web Trading Platform

AFA REGIONAL SPONSOR
AFA REGIONAL SPONSOR
Markets
Analysis
Education
Signals
Trade
More
 Trading Central
 Argentine Football Association
 ACF Fiorentina
 Visa/Mastercard
Online trading is complex with high risks. Please invest cautiously.