Support
Mobile Trading App
PC Trading App
Web Trading Platform
Download

Blogs About Trading
Technical Analysis: XAUUSD
12.11.2024
XAUUSD plummeted by more than 2%
On Monday, XAUUSD fell sharply, with prices approaching the $2,610 mark. It ended down 2.39% at $2,619.53 per ounce.
The USDX hit a four-month high again
On Monday, the USDX hit a four-month high again, reaching an intraday high of 105.709. It ended up 0.524% at 105.5.
Gold ETF holdings decreased
As of November 11, the world's largest gold ETF, SPDR Gold Trust, held 871.97 tons of gold, a decrease of 4.88 tons from the previous trading day.
Technically speaking, the bearish market trend prevailed in the short term
 the Chart of the Day
On the chart of the day, XAUUSD fell sharply from its highs. The bearish market trend prevailed in the short term. In terms of technical indicators, KDJ fell after a high-level death cross, showing XAUUSD will fall further. Investors should focus on whether XAUUSD will break through the support at 2600. It will fall further with potential support at 2550 if it breaks below 2600.
 4-hour chart
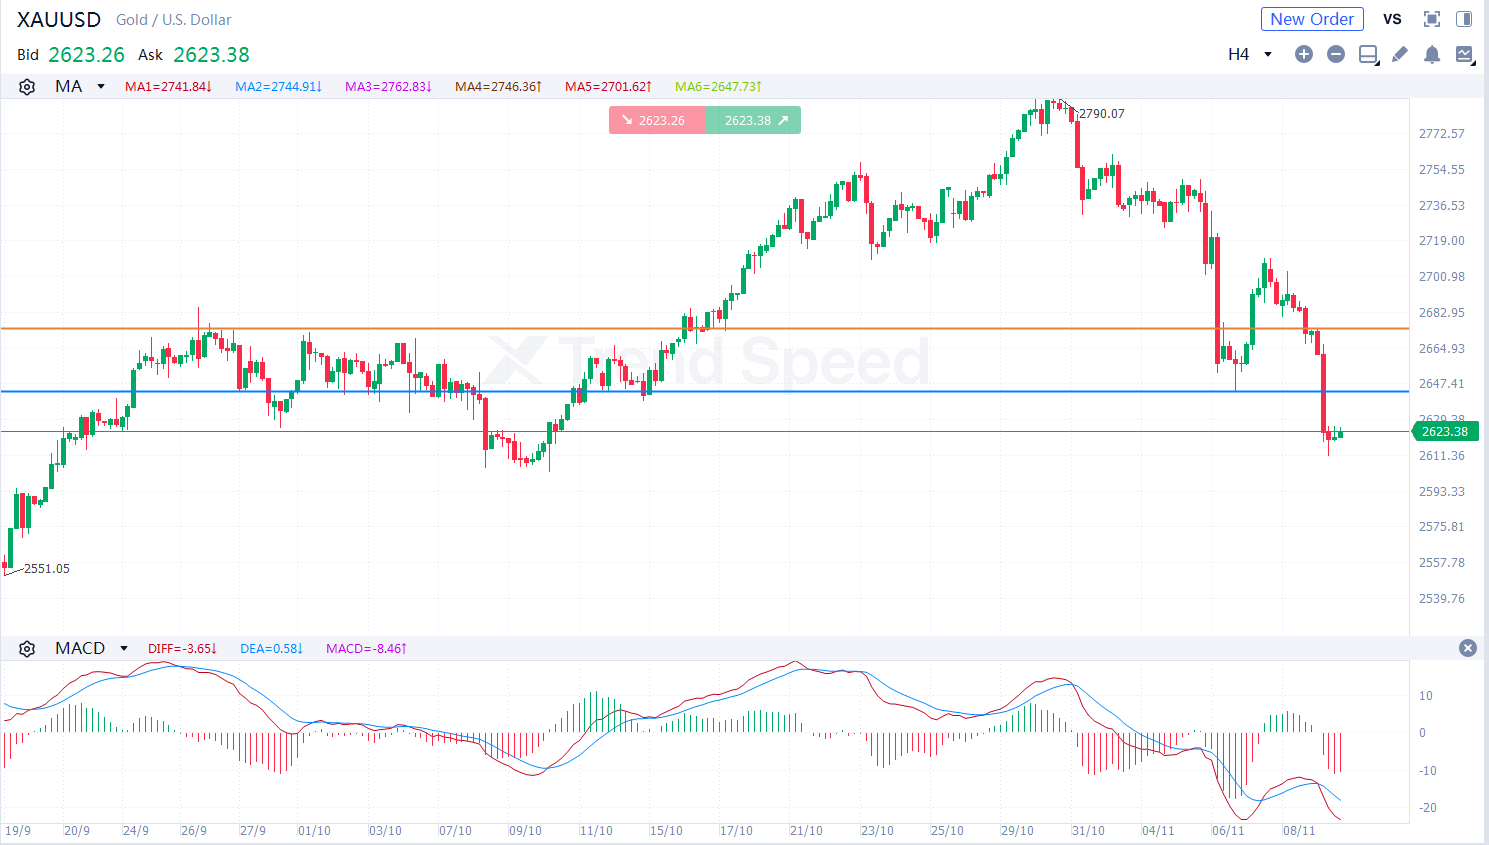
On the 4-hour chart, XAUUSD was prone to fluctuation and declined. The bearish market trend prevailed. In terms of technical indicators, MACD fell after death cross, showing that the market trend is bearish. Investors should focus on whether XAUUSD will break through the resistance at 2643. It will fall further if it rebounds but is capped at 2643.
Key resistance: 2643,2675
Key support:2600,2550
Generally speaking, affected by the strong rise of the USDX, XAUUSD is more likely to fall in the short term. Investors should focus on the results of the the speeches of Fed officials during the day.
Hot
Technical Analysis: EURUSD
31.12.2025
Technical Analysis: GBPUSD
30.12.2025
Technical Analysis: XAUUSD
06.01.2026
Technical Analysis: XAGUSD
15.01.2026
Technical Analysis: XAUUSD
13.01.2026


