

Support
Mobile Trading App
PC Trading App
Web Trading Platform
Download

Blogs About Trading
Technical Analysis: USOIL
16.05.2023
USOIL Climbed after Falling for Three Consecutive Days
On Monday, USOIL increased by around 2% after falling for three consecutive days. It ended at US$71.27 per barrel on Monday.
The US Announced the Crude Oil Repurchase Program
The US Department of Energy said on Monday that it will add 3 million barrels of crude oil into SPR, adding that the delivery date is August. It also asked sellers to offer quoted price before May 31.
Crude Oil Exports were Expected to Plunge in May
As the voluntary production reduction by Saudi Arabia ans other OPEC+ countries took effect, crude oil exports plunged from 7,580 thousand barrels per day in April to 6,480 thousand barrels per day in May in Saudi Arabia.
USOIL Rebounded in the Short Term
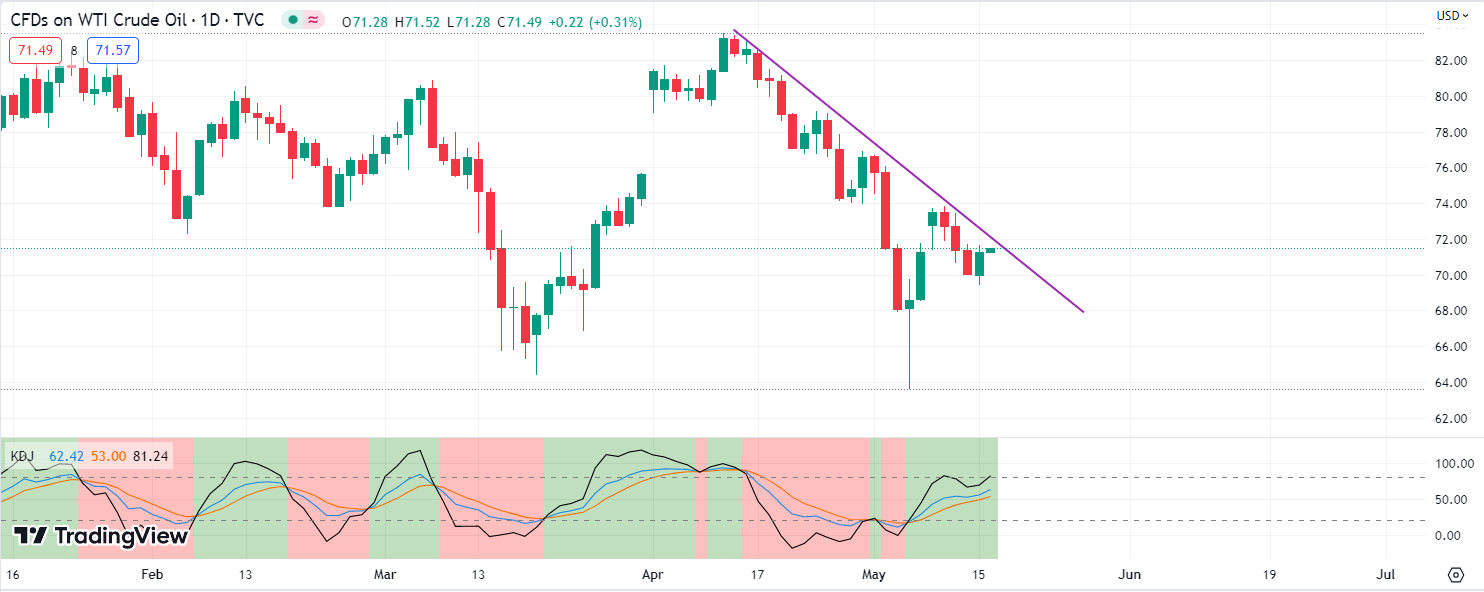
the Chart of the Day
On the chart of the day, USOIL climbed yesterday after falling consecutively. In terms of technical indicators, KDJ went upwards after golden cross occurred, demonstrating that USOIL will rise further. USOIL will climb further if it is stable above the support at 69.4.
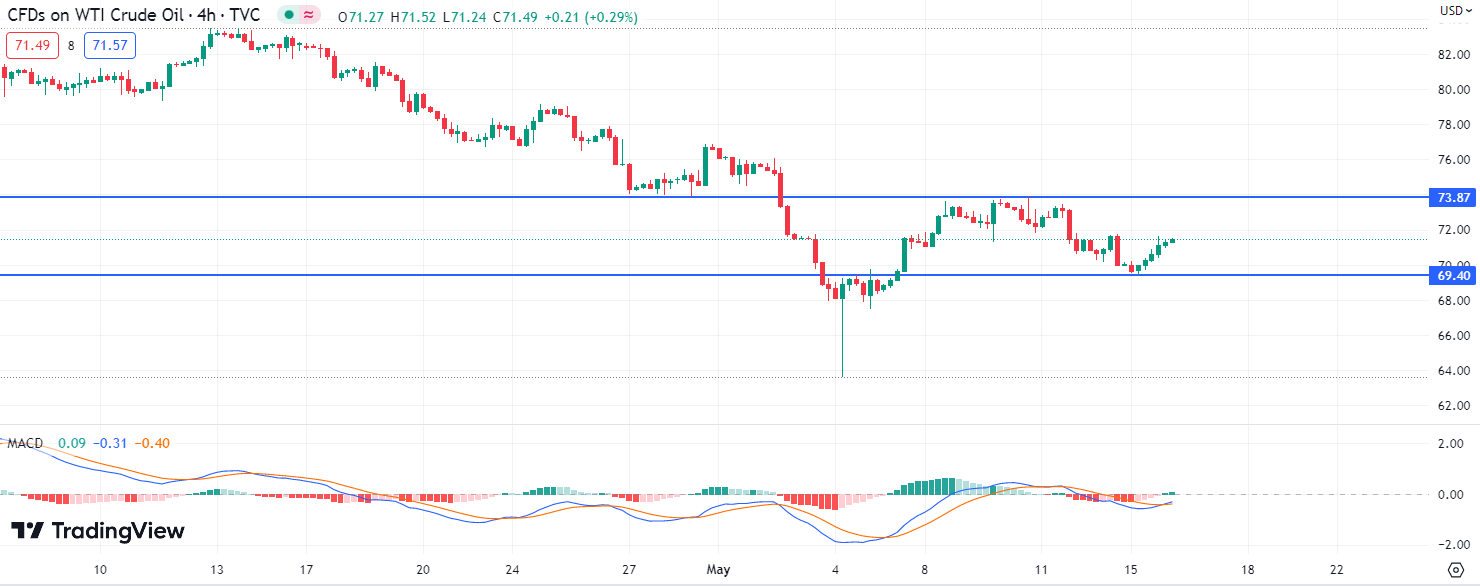
4-hour chart
On the 4-hour chart, USOIL rebounded from a low level. The market trend is bullish in the short term. In terms of technical indicators, MACD went upwards after golden cross occurred, demonstrating that the market trend is bullish. USOIL will climb further with potential resistance at 74.0 if it breaks above the resistance at 72.0.
Key resistance: 72.0, 74.0
Key support: 69.4, 68.0
Generally speaking, boosted by many positive factors, USOIL is likely to climb in the short term. Investors should focus on API crude oil inventories during the day.
Hot
Technical Analysis: AUDUSD
18.03.2026
Technical Analysis: EURUSD
26.02.2026
Technical Analysis: USOIL
04.03.2026
Technical Analysis: USDJPY
05.03.2026
Technical Analysis: XAGUSD
17.03.2026

Mobile Trading App
PC Trading App
Web Trading Platform

AFA REGIONAL SPONSOR
AFA REGIONAL SPONSOR
Markets
Analysis
Education
Signals
Trade
More
 Trading Central
 Argentine Football Association
 ACF Fiorentina
 Visa/Mastercard
Online trading is complex with high risks. Please invest cautiously.