Support
Mobile Trading App
PC Trading App
Web Trading Platform
Download

Blogs About Trading
Technical Analysis: USOIL
09.07.2024
On Monday, Oil prices retreated as geopolitical tensions eased, ultimately closing down 1.4%, ending a recent rally.
Gaza ceasefire talks disrupt oil prices
The ceasefire talks, brokered by Qatar and Egypt, aim to end the nine-month conflict in Gaza and ease tensions in the oil-rich Middle East.
Some OPEC+ members are overproducing
Several OPEC members, notably Iraq, Kazakhstan and Russia, continue to overproduce despite pledges to stick to quotas.
Technically speaking, the bearish market trend prevailed in the short term 
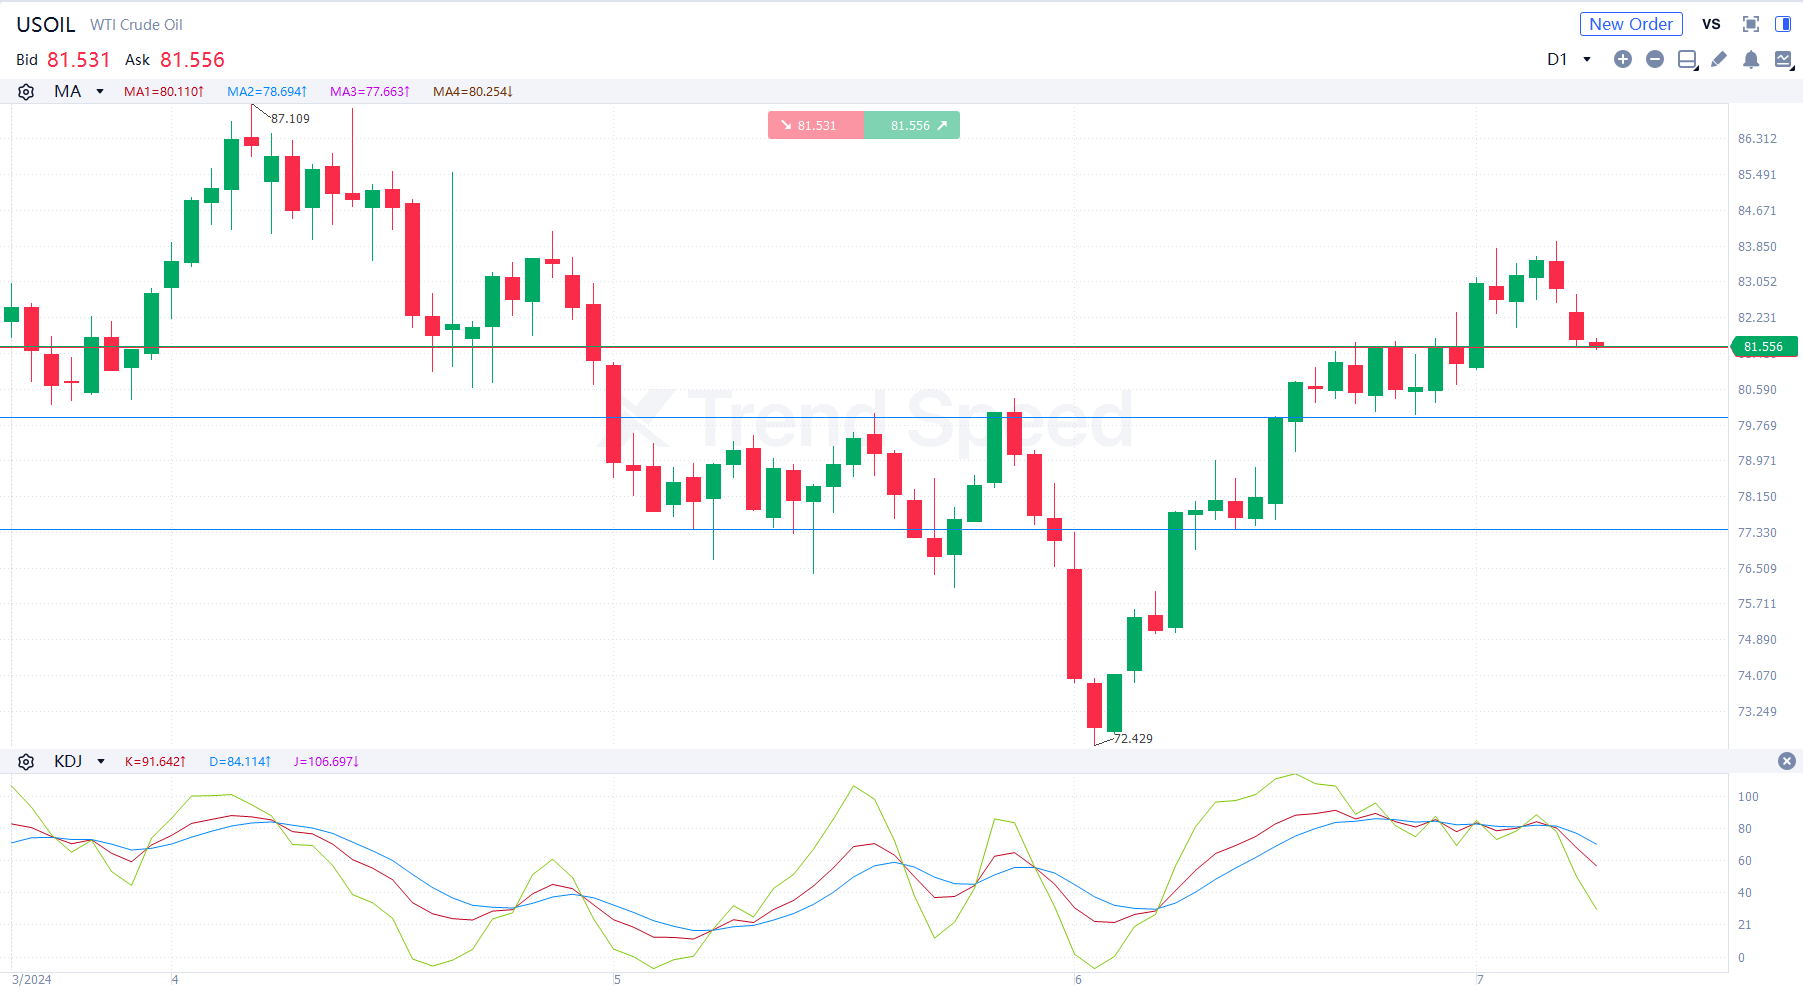
the Chart of the Day
On the chart of the day, USOIL fell sharply yesterday. The bearish market trend prevailed in the short term. In terms of technical indicators, KDJ went downwards after death cross occurred, showing USOIL will fall further. It will continue dipping with potential support at 77.6 if it breaks below the support 80.0. 
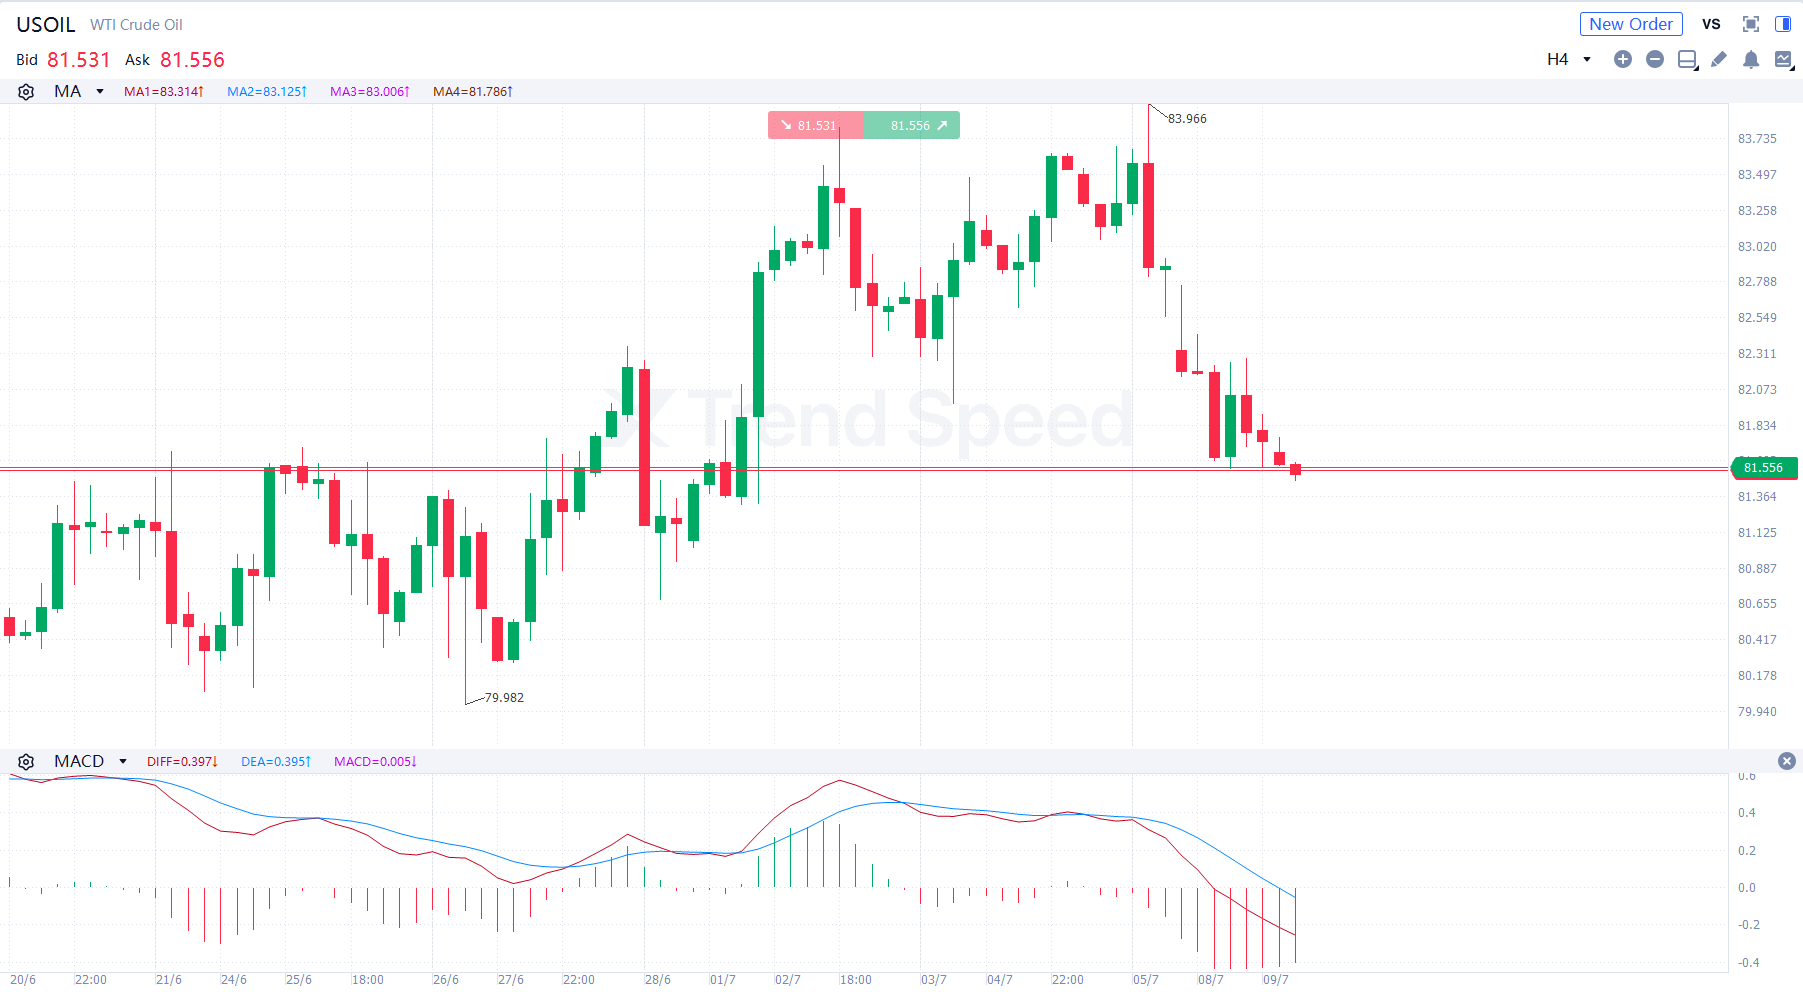
4-hour chart
On the 4-hour chart, USOIL fluctuated and declined in the short term. The bearish market trend prevailed. In terms of technical indicators, MACD went downwards after death cross occurred at a high level, showing that the market trend is bearish. Investors should focus on whether USOIL will break through the resistance at 82.8. It will fall further if it rebounds but is capped at 82.8.
Key resistance: 82.8,83.9,
Key support: 80.0, 77.6
Generally speaking, affected by geopolitical factors, oil prices have fallen back, and the short-term downside risk is relatively large. Investors should focus on US economic data during the day.
Hot
Technical Analysis: USOIL
06.11.2025
Technical Analysis: EURUSD
22.10.2025
Technical Analysis: AUDUSD
05.11.2025
Technical Analysis: XAUUSD
28.10.2025
Technical Analysis: XAUUSD
11.11.2025


