MENU
Scan to Download the Mobile App
Best Mobile Broker
Download the Desktop Version
More Advanced Analysis Tools and Technical Indicators
Launch in Browser
Trade Without Downloads
English
English
Deutsch
Français
Español
italiano
Português
简体中文
繁體中文
ViệtName
Čeština
Nederlands
한국인
हिंदी
عربي
Русский
polski
български
Melayu
Ελληνικά
svenska
Српски
dansk
norsk
slovenský
Hrvatski

Analysis and Education
Selected Ideas

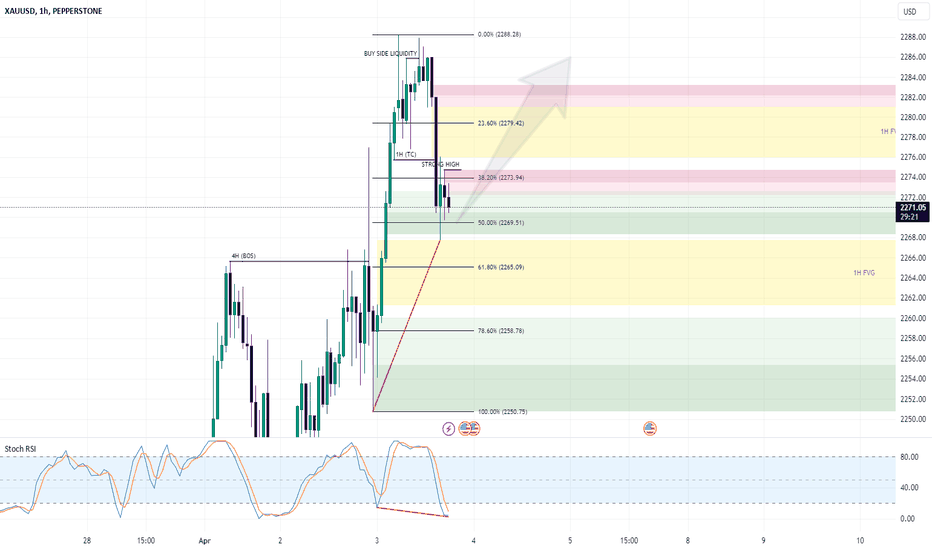
GOLD to bounce off from current level and continue bullish
XAUUSD ·
Wed Apr 03 10:30:39 UTC 2024
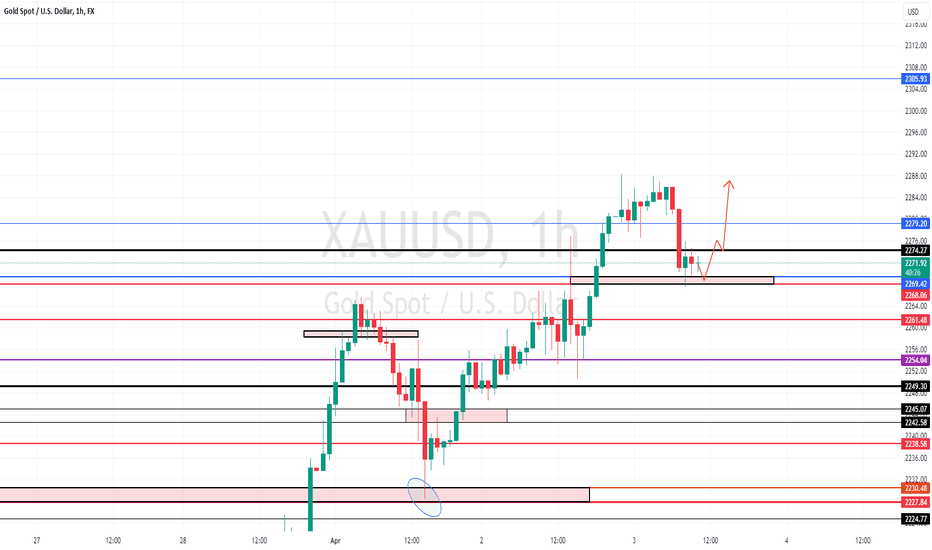
PEPPERSTONE:XAUUSD GOLD had been bullish for multiple weeks for now. Today, London had some correction moving into the news tonight. 1H chart has also created a bullish divergence. I would like to see a bounce off back towards the buy side.
Details
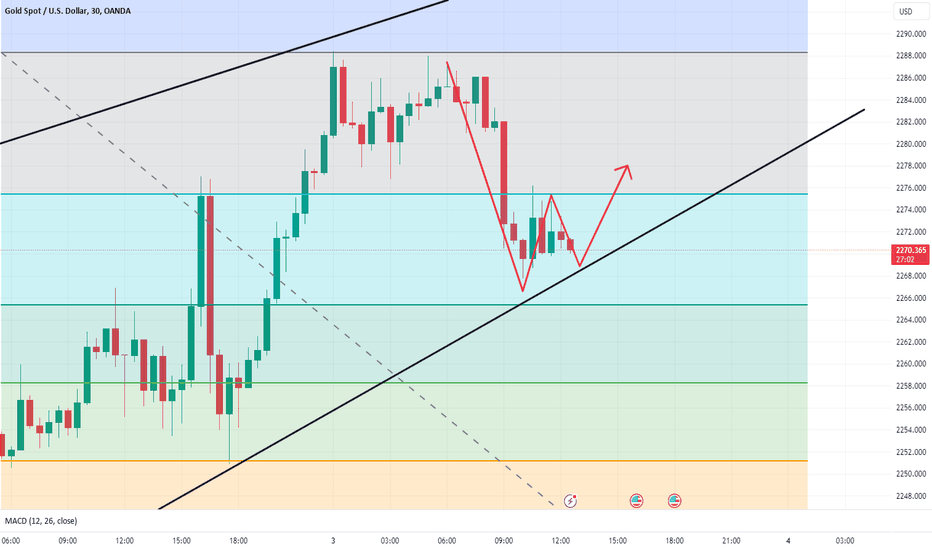
Above 2260, gold will continue its bullish pattern
XAUUSD ·
Wed Apr 03 10:33:10 UTC 2024
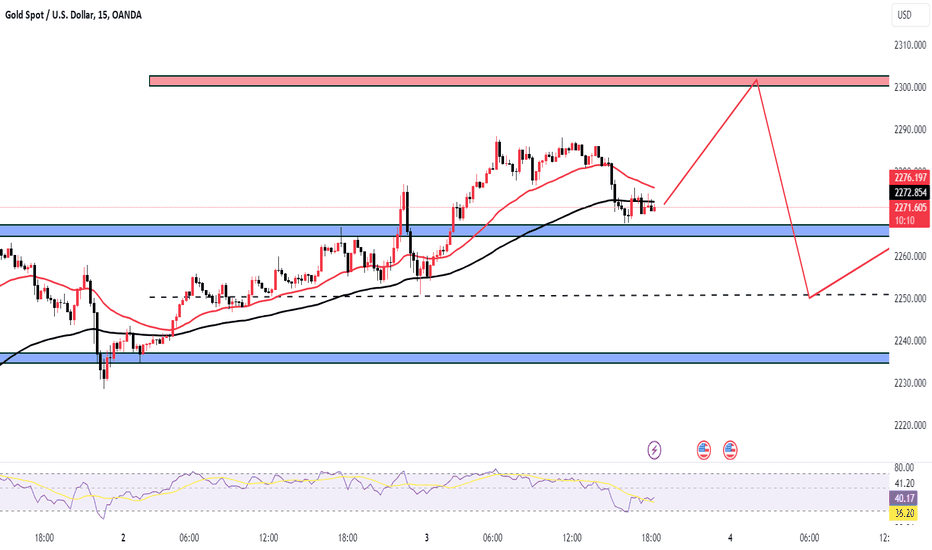
Dear friends, gold hit its highest level near 2288 and then fell back. It is currently trading near 2271. Gold is currently showing an irrational market. On the one hand, due to the expansion of the situation in the Middle East and the conflict between Russia and Ukraine, safe-haven assets have been rushing into the market. On the other hand, silver and oil have...
Details
divergence
XAUUSD ·
Wed Apr 03 10:35:35 UTC 2024
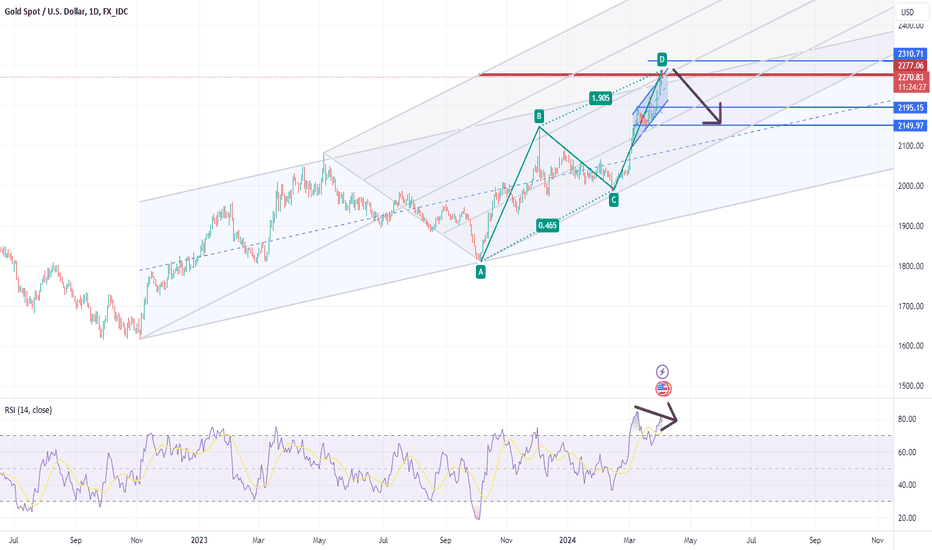
In my opinion, these gold prices are suitable for selling, all long-term and short-term resistances and classical and harmonic patterns will indicate the decline of gold.
Details
GOLD.. where is today support ? holding or not?
XAUUSD ·
Wed Apr 03 10:19:35 UTC 2024
#GOLD.. well guys market exact move as per our video analysis in morning, now market have today supporting area at 2268 keep close it because it will play key role in today, lots of datas on table in today, and you have only supporting area 2268, stay sharp here, only invalid if market close below 2268 good luck trade wisely
Details
Gold reached a new peak and is expected to continue to increase
XAUUSD ·
Wed Apr 03 10:19:51 UTC 2024
☘️Gold prices are rising as traders predict that the European Central Bank (ECB), Bank of England (BoE) and US Federal Reserve (Fed) will cut interest rates next June due to Inflation is cooling down. “As interest rates fall, gold becomes more attractive compared to fixed assets such as bonds, which offer weaker returns in a lower interest rate environment,” said...
Details
Buy silver for a longtime
XAGUSD ·
Wed Apr 03 10:14:31 UTC 2024
Hi guys, XAGUSD finally broke up the long-term triangle in daily time frame and unfortunately didn't reach to our favorite support level. We want to buy it for several months and it is very worthy instead of Gold because of far from all time high. Buy it in pullback on triangle line 24-25.5 . TP 50 final TP 75 SL 20 RR 1:5 Write your opinion here. Be success :-)
Details
xauusd_ GOLD Buy zone
XAUUSD ·
Wed Apr 03 10:01:19 UTC 2024
xauusd_ GOLD Buy zone for you guy first dont forget risk management then trade
Details
WTI OIL Big rally ahead unless it breaks below the 1W MA100.
USOIL ·
Wed Apr 03 10:02:55 UTC 2024
WTI Oil (USOIL) hit our long-term 82.50 Target last week, a call made early this year (January 12, see chart below) when the price was still at $74.33: At the moment, the price sits above the 1W MA100 (green trend-line) for the first time since the week of October 23 2023, as the week opened above it. This calls for an upward extension similar to the...
Details
XAUUSD SHORT
XAUUSD ·
Wed Apr 03 10:04:00 UTC 2024
XAUUSD Short is idea for now until i see further development on LTF such as D1 and H4. What I am seeing here is a reversal from W1 TL after Monday and Tuesday ATH's. How much more can XAUUSD keep pushing it's bullish momentum. Where does this power come from? DXY is not this weak...it has corrective nature which makes it very odd for XAUUSD to be acting like this....
Details
After falling back to confirm support, and go long gold
XAUUSD ·
Wed Apr 03 10:04:19 UTC 2024
Dear friends, gold hit its highest level near 2288 and then fell back. It is currently trading near 2271. Gold is currently showing an irrational market. On the one hand, due to the situation in the Middle East and the expansion of the conflict between Russia and Ukraine, safe-haven assets have been rushing into the market. On the other hand, silver and oil have...
Details
The trend of spot gold rebounds and continues to be long
XAUUSD ·
Wed Apr 03 10:05:51 UTC 2024
Recently, many investment friends have come to me and asked me how to analyze and read the market, or they have placed orders in the hope of getting my help. I have also helped many investment friends. I personally believe that investment friends should improve their own abilities during the investment process, use their own technical knowledge to analyze and...
Details
XAU / USD 1 Hour Chart
XAUUSD ·
Wed Apr 03 09:50:25 UTC 2024
Hello traders. Happy Wednesday. Taking a look at the 1 hour chart I have marked my areas of interest. It is mid week, we still can see some more potential upside, and we are in need of a correction... Saying that, I crushed gold this week and i am no hurry to rush or force a trade. Clean Buys with a break above 2273.31 for a nice 40 pip scalp or so. Possible...
Details
GOLD-How much further can gold rise?
XAUUSD ·
Wed Apr 03 09:52:19 UTC 2024
Key data for the week will be released starting today. Data released on Monday showed that U.S. manufacturing activity expanded in March for the first time in a year and a half. After the data was released, the probability of an interest rate cut in June dropped to 58% from about 60% previously. However, Fed officials’ speeches on Tuesday and The modest slowdown...
Details
🔥Gold pullback goes long✅
XAUUSD ·
Wed Apr 03 09:43:04 UTC 2024
In the early European session on Wednesday, April 3rd, spot gold suddenly plunged, with prices falling rapidly towards $2,275 per ounce, marking a short-term drop of over $10. With recent rapid gains in gold prices and technical indicators showing overbought conditions, there is a short-term risk of a correction. However, as long as gold holds above the key level...
Details
GOLD → A correction before further growth?
XAUUSD ·
Wed Apr 03 09:44:33 UTC 2024
FX:XAUUSD has been forming a small correction towards liquidity zones since the opening of the session. On the background of strong bullish trend it is quite logical scenario before the news publication. The dollar index is testing a strong resistance before the news and a correction is possible, which will only strengthen the growth of gold. But, it is...
Details

More…

Economic Calendar
07-1807-1907-2007-2107-22
  • Actual
  • Forecast
  • Prior
  • No Data

More…

News

According to Iran's Tasnim News Agency, the Iranian Islamic Revolutionary Guard Corps stated that it had launched an attack on US fighter jet facilities at the Sheikh Issa Air Base.

News Flash18-07 05:09From XTrend Speed
According to Iran's Tasnim News Agency, the Iranian Islamic Revolutionary Guard Corps stated that it had launched an attack on US fighter jet facilities at the Sheikh Issa Air Base.

According to Iran's Tasnim News Agency: Iran's Islamic Revolutionary Guard Corps said that if its territory is used to attack Iran, countries with US troops stationed should expect a "corresponding response."

News Flash18-07 04:22From XTrend Speed
According to Iran's Tasnim News Agency: Iran's Islamic Revolutionary Guard Corps said that if its territory is used to attack Iran, countries with US troops stationed should expect a "corresponding response."

According to Iran's Tasnim News Agency: Iran's Islamic Revolutionary Guard Corps stated that it carried out strikes against US military facilities in Kuwait.

News Flash18-07 04:21From XTrend Speed
According to Iran's Tasnim News Agency: Iran's Islamic Revolutionary Guard Corps stated that it carried out strikes against US military facilities in Kuwait.

The biggest problem isn't caused by what you don't know, but by "what you're absolutely certain of, but the truth is quite the opposite." This is a huge problem facing the stock market right now; the market is genuinely questioning everything it knows. This is evident in major indices: the S&P 500 fell 1.6% this week, the Nasdaq Composite dropped 2.9%, and the Nasdaq 100 declined 2.7%, on track for its worst July performance in over two decades. Everything people were once certain of is crumbling. Driven by supply shortages and insatiable demand for artificial intelligence, chip stocks should have been unstoppable. Now, the Philadelphia Semiconductor Index has fallen 20% from its June 22 peak and entered bear market territory on Friday. This pain is also evident in Asian markets, with South Korea's KOSPI index falling over 25% and Japan's NI225 plunging 4% on Friday, entering technical correction territory. However, what's perhaps more worrying about this sell-off is the lack of a clear catalyst. Admittedly, we can point to a number of issues, including concerns about the chip sector's rapid first-half gains, the massive borrowing by large tech companies for huge capital expenditure plans, and the continued uncertainty surrounding the economic backdrop under the Fed's new policies. This helps explain the rotation currently occurring in the broader market. However, the stock market's capacity to withstand weakness in its largest and hottest stocks, such as chip stocks, is limited and will eventually become unsustainable. Jonathan Klinsky, chief market technical analyst at BTIG, fears a sharp correction similar to the summer of 2024, which could push the S&P 500 below its 200-day moving average (6983 points). Klinsky warns that if this materializes, the semiconductor sector will continue to weaken and fall further, while some of the recent "broad-based trading" and the "Big Seven" will stall and turn downwards. The market seems to be quietly moving in this direction, even though the headlines driving the decline don't look particularly alarming.

News Flash18-07 04:10From XTrend Speed
The biggest problem isn't caused by what you don't know, but by "what you're absolutely certain of, but the truth is quite the opposite." This is a huge problem facing the stock market right now; the market is genuinely questioning everything it knows. This is evident in major indices: the S&P 500 fell 1.6% this week, the Nasdaq Composite dropped 2.9%, and the Nasdaq 100 declined 2.7%, on track for its worst July performance in over two decades. Everything people were once certain of is crumbling. Driven by supply shortages and insatiable demand for artificial intelligence, chip stocks should have been unstoppable. Now, the Philadelphia Semiconductor Index has fallen 20% from its June 22 peak and entered bear market territory on Friday. This pain is also evident in Asian markets, with South Korea's KOSPI index falling over 25% and Japan's NI225 plunging 4% on Friday, entering technical correction territory. However, what's perhaps more worrying about this sell-off is the lack of a clear catalyst. Admittedly, we can point to a number of issues, including concerns about the chip sector's rapid first-half gains, the massive borrowing by large tech companies for huge capital expenditure plans, and the continued uncertainty surrounding the economic backdrop under the Fed's new policies. This helps explain the rotation currently occurring in the broader market. However, the stock market's capacity to withstand weakness in its largest and hottest stocks, such as chip stocks, is limited and will eventually become unsustainable. Jonathan Klinsky, chief market technical analyst at BTIG, fears a sharp correction similar to the summer of 2024, which could push the S&P 500 below its 200-day moving average (6983 points). Klinsky warns that if this materializes, the semiconductor sector will continue to weaken and fall further, while some of the recent "broad-based trading" and the "Big Seven" will stall and turn downwards. The market seems to be quietly moving in this direction, even though the headlines driving the decline don't look particularly alarming.

Iranian state television quoted the Iranian military as saying that Iran had carried out attacks on U.S. military assets and fuel tanks in Bahrain.

News Flash18-07 03:25From XTrend Speed
Iranian state television quoted the Iranian military as saying that Iran had carried out attacks on U.S. military assets and fuel tanks in Bahrain.

Russia said that Ukraine launched 370 drones towards Moscow and had shot down most of them.

News Flash18-07 03:15From XTrend Speed
Russia said that Ukraine launched 370 drones towards Moscow and had shot down most of them.

More…

  • How to use credit

    NEW

  • How to complete "About You"?

Trading Knowledge

Trading Terminology

Basic Knowledge
Open Positions:

refer to the state of a trade after a trader has entered the market. Traders can Buy or Sell to enter the market.


Closed Positions:

refers to executing a security transaction that is the exact opposite of an open position, thereby nullifying it and eliminating the initial exposure.


Close Out:

When your account's Equity reaches 50% of your Used margin , the system will automatically close out positions. The system will start closing positions that have the highest loss until the ratio is greater than 50%.


IMPORTANT NOTE: You should set “stop loss” and “take profit” in time when trading.

How to calculate profit and loss?

Product Guide
Profit/Loss = Price Difference in pips * Pip Value


For example, you buy 100 AUDUSD with a pip value of 0.01 USD and required margin of $5.

The opening price is 0.78260 and the closing price is 0.78220.

Their price difference in pips is -4 pips [(0.78220-0.78260)/0.0001 - The pip for AUDUSD is the fourth decimal point, ie. 0.0001].

Hence, the profit/loss (P/L) is -$0.04.

What is Margin Level?

Product Guide
● The margin level is a risk management gauge that helps you understand how the currently opened positions influence your account.

● Margin level is a mathematical equation that effectively tells the trader how much of their funds are available for new trades

● The higher the margin level, the higher the amount of cash available to trade

● The lower the margin level, the lower the amount of cash available to trade and the account could be subject to a margin call.

● Monitoring margin level is important for managing your account. If it falls to 100% the system will not allow you to open new positions, and in the case it falls further, some of your positions may be forcibly closed. You can raise it, either by adding funds to your account to increase equity or by closing some positions to reduce used margin.

If your margin level is getting close to 50%, you are in danger of having some of your positions forcibly closed. When the margin level is less than or equal to 50%, the positions with the greater losses will be closed out until the margin level rises above 50%. The positions opened by coupons will not be influenced and hence coupon trades will not be closed out.


How is margin level calculated?

It is calculated by the following formula:

Margin level = (equity ÷ used margin) × 100%

If you don't have any trades open, your margin level will be “- “


Margin level example

If your account equity is $8,000 and your used margin is $2,000 then your margin level is 400%.

Important Economic Data - Released Dates

Economic Calendar
NFP:

At 15:30 (GMT +2) on the first Friday of every month


GDP of major currencies (EUR, USD, GBP, AUD, NZD & JPY):

Released on a quarterly basis.


CPI of major currencies (EUR, USD, GBP, AUD, NZD & JPY) :

Released monthly.


U.S. Initial jobless Claims :

At 15:30 (GMT +2) every Thursday


U.S. Durable Goods Orders :

At 14:30 (GMT + 2) once a month


FOMC Minutes:

The Committee meets eight times a year, approximately once every 6 weeks


EIA:

At 17:30 (GMT + 2) every Wednesday


OPEC meeting:

Twice in a year, usually in June and December

Candlestick Chart

Candlestick Chart
There are two basic candlesticks:

1. Bullish Candle: When the close is higher than the open (usually green or white).

2. Bearish Candle: When the close is lower than the open (usually red or black).


There are three main parts to a candlestick:

1. Upper Shadow: The vertical line between the high of the day and the close (bullish candle) or open (bearish candle).

2. Real Body: The difference between the open and close; colored portion of the candlestick.

3. Lower Shadow: The vertical line between the low of the day and the open (bullish candle) or close (bearish candle).


Candlestick Patterns


1.White Marubozu

Formation: When the opening price equals the bottom price and the closing price equals the top price. The body colour is white or green without shadows.

Meaning: The buyers maintained control of the price - Bullish.

Forecast: It indicates the continuation at the end of an uptrend or a reversal at the end of a downtrend.


2.Black Marubozu

Formation: When the opening price equals the top price and the closing price equals the bottom price. The body colour is black or red without shadows.

Meaning: The sellers maintained control of the price - Bearish

Forecast: It indicates the continuation at the end of a downtrend or a reversal at the end of an uptrend.


3.Closing Black Marubozu

Formation: When the closing price equals the top price and no lower shadow is created.

Meaning: The sellers took control of the price - Bearish.

Forecast: It indicates the continuation at the end of a downtrend or a reversal at the end of an uptrend.


4.Hammer

Formation: Small candlestick body with a long lower shadow and a short or absent upper shadow.

Meaning: The buyers were able to overcome the selling pressure and close near the open - Bullish.

Forecast: It indicates a reversal after a downtrend or a support level which requires further bullish confirmation.


5.Shooting Star

Formation: Small candlestick body with a long upper shadow and a short or absent lower shadow.

Meaning: The sellers were able to overcome the buying pressure - Bearish.

Forecast: It indicates a reversal after an uptrend or a resistance level which requires further bearish confirmation.


6.Spinning Tops

Formation: Small candlestick body with a long upper shadow and a long lower shadow.

Meaning: Neither the sellers or the buyers were able to take over - Neutral.

Forecast: If it forms during an uptrend, it could mean that not many buyers are left and a possible reversal might occur. If it forms during a downtrend, it could mean that not many sellers are left and a possible reversal might occur.


7.Doji

Formation: Opening and closing prices are effectively equal with a long upper shadow and a long lower shadow.

Meaning: Neither the sellers or the buyers were able to take over - Neutral.

Forecast: It indicates indecision and is often formed during resting periods after a significant move either higher or lower.


The above are some types of candlestick patterns that can be formed. The different types can be categorised as single, double and triple candlestick formations. Please always take market conditions and price action signal into consideration before acting on a single candlestick pattern.

More…