

Support
Mobile Trading App
PC Trading App
Web Trading Platform
Download

Blogs About Trading
Technical Analysis: GBPUSD
28.05.2024
GBPUSD reached a two-month high
On Monday, GBPUSD continued climbing. It reached 1.2777 at one point, which marked the highest level since March 21.
Retail price index growth decreased to a two-year low in May
UK retail price index growth, y/y (May) fell to 0.6%, which marked the lowest level since the end of 2021, showing that economic prospect will improve, according to the data from the BRC.
The USDX fluctuated and fell
On Monday, the USDX fluctuated and fell. It ended down 0.14% at 104.6.
Technically speaking, the bullish market trend prevailed in the short term
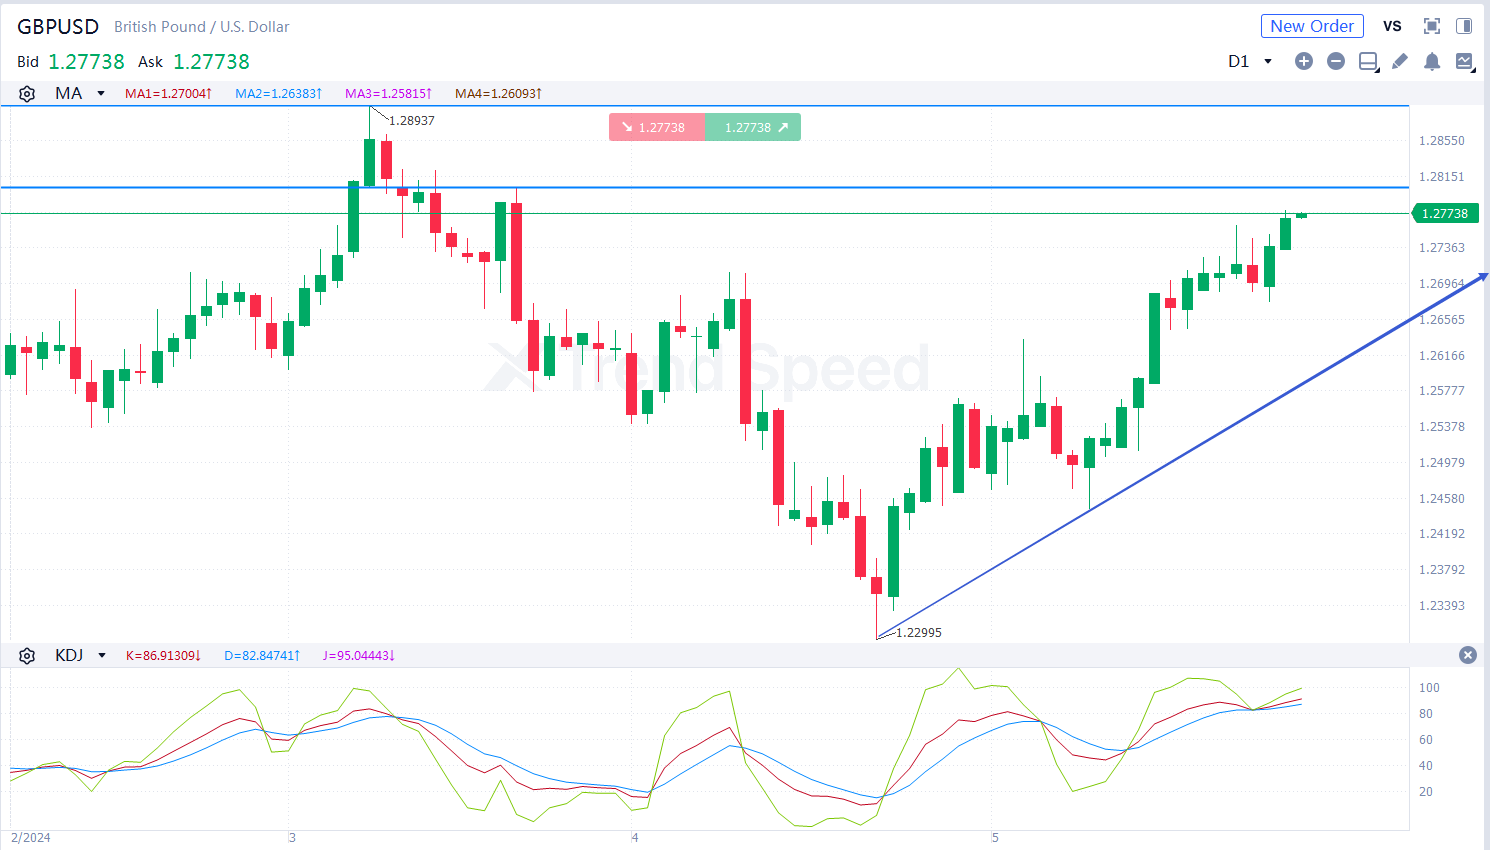
the Chart of the Day
On the chart of the day, GBPUSD continued climbing. The bullish market trend prevailed in the short term. In terms of technical indicators, KDJ went upwards after golden cross occurred, showing GBPUSD will rise further. GBPUSD will continue climbing with potential resistance at 1.289 if it breaks above 1.280.
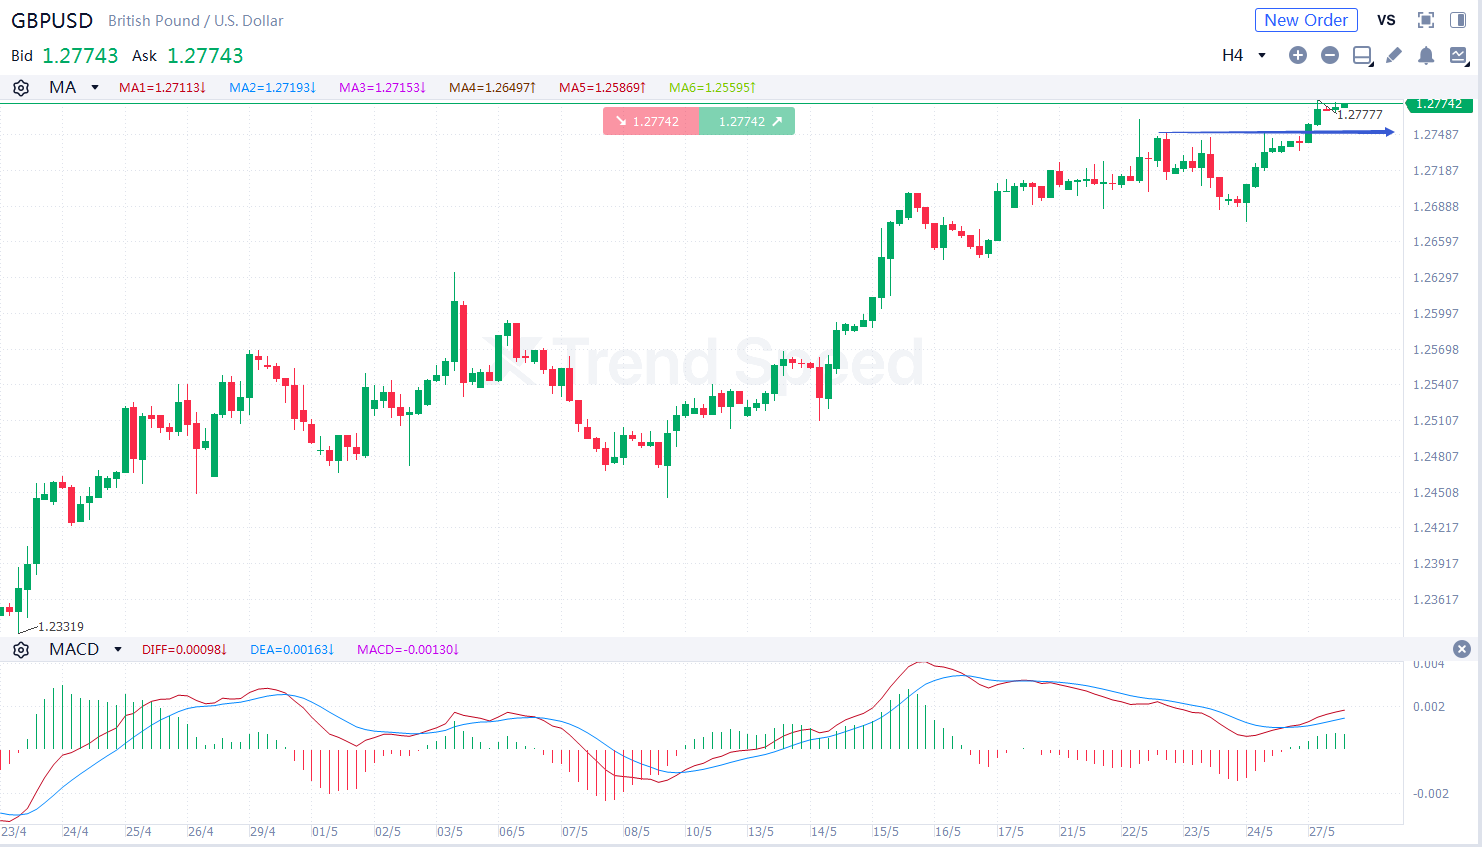
4-hour chart
On the 4-hour chart, GBPUSD was prone to fluctuation and climbed. The bullish market trend prevailed in the short term. In terms of technical indicators, MACD went upwards after golden cross occurred, showing the market trend is bullish. GBPUSD will rise further if it retreats but is stable above 1.274.
Key resistance: 1.280, 1.289
Key support: 1.274, 1.267
Generally speaking, as UK economic prospect improved and the USDX fell, GBPUSD is more likely to rise further in the short term. Investors should focus on UK CBI Retail Sales Differentials (May) during the day.
Hot
Technical Analysis: USDJPY
25.02.2026
Technical Analysis: EURUSD
26.02.2026
Technical Analysis: XAUUSD
24.02.2026
Technical Analysis: USOIL
04.03.2026
Technical Analysis: USDJPY
05.03.2026

Mobile Trading App
PC Trading App
Web Trading Platform

AFA REGIONAL SPONSOR
AFA REGIONAL SPONSOR
Markets
Analysis
Education
Signals
Trade
More
 Trading Central
 Argentine Football Association
 ACF Fiorentina
 Visa/Mastercard
Online trading is complex with high risks. Please invest cautiously.