
 MENU
MENU






Blogs About Trading
Technical Analysis: NZDUSD
28.11.2024
NZDUSD surged 1%
On Wednesday, NZDUSD surged 1%, breaking through the 0.590 mark, hitting a one-week high.
Reserve Bank of New Zealand cut interest rates by 50 basis points
On Wednesday, the Reserve Bank of New Zealand announced a 50 basis point rate cut, with the benchmark interest rate falling from 4.75% to 4.25%, the third consecutive rate cut by the Reserve Bank of New Zealand.
The statement pointed out that as overall inflation is close to the midpoint of the target and core inflation indicators are gradually moving closer to the midpoint, the committee is more confident in continuing to lift monetary policy restrictions.
The committee unanimously agreed that a 50 basis point rate cut is consistent with its mission to maintain low and stable inflation while striving to avoid unnecessary economic fluctuations, including fluctuations in output, employment, interest rates and exchange rates.
USDX fell to a two-week low
On Wednesday, USDX fell to a two-week low as investors were cautious about Trump's tariff commitments. It ended down 0.75% at 106.07.
Technically speaking, the bullish market trend prevailed in the short term
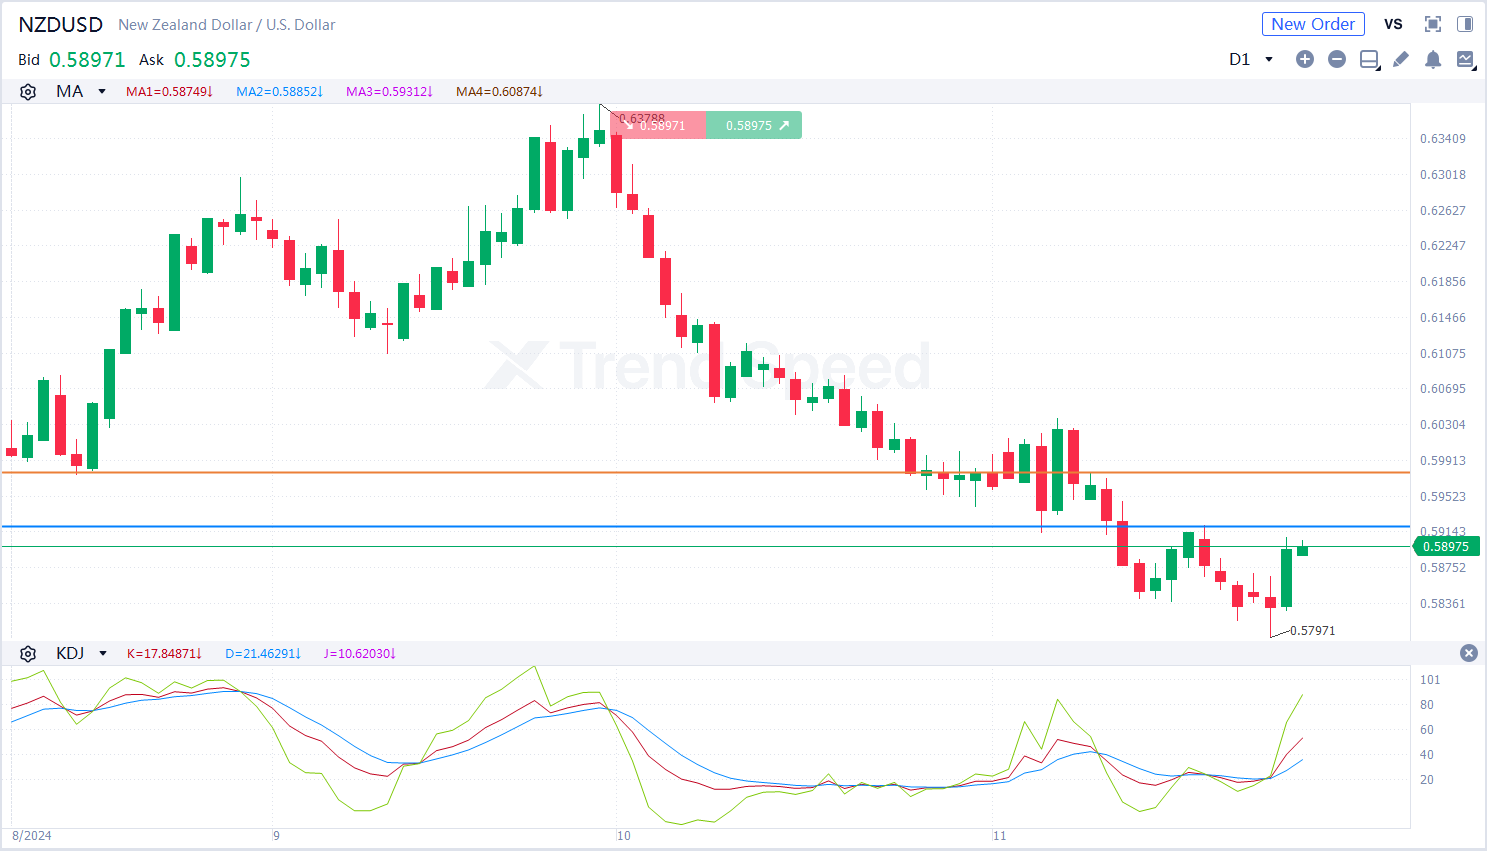 the Chart of the Day
On the chart of the day, NZDUSD stabilized and rebounded from lows. The bullish market trend prevailed in the short term. In terms of technical indicators, KDJ went upwards after the golden cross, showing that NZDUSD will rise further. Investors should focus on whether NZDUSD will break through the resistance at 0.592. The upper resistance will be around 0.598 if it breaks above the resistance at 0.592.
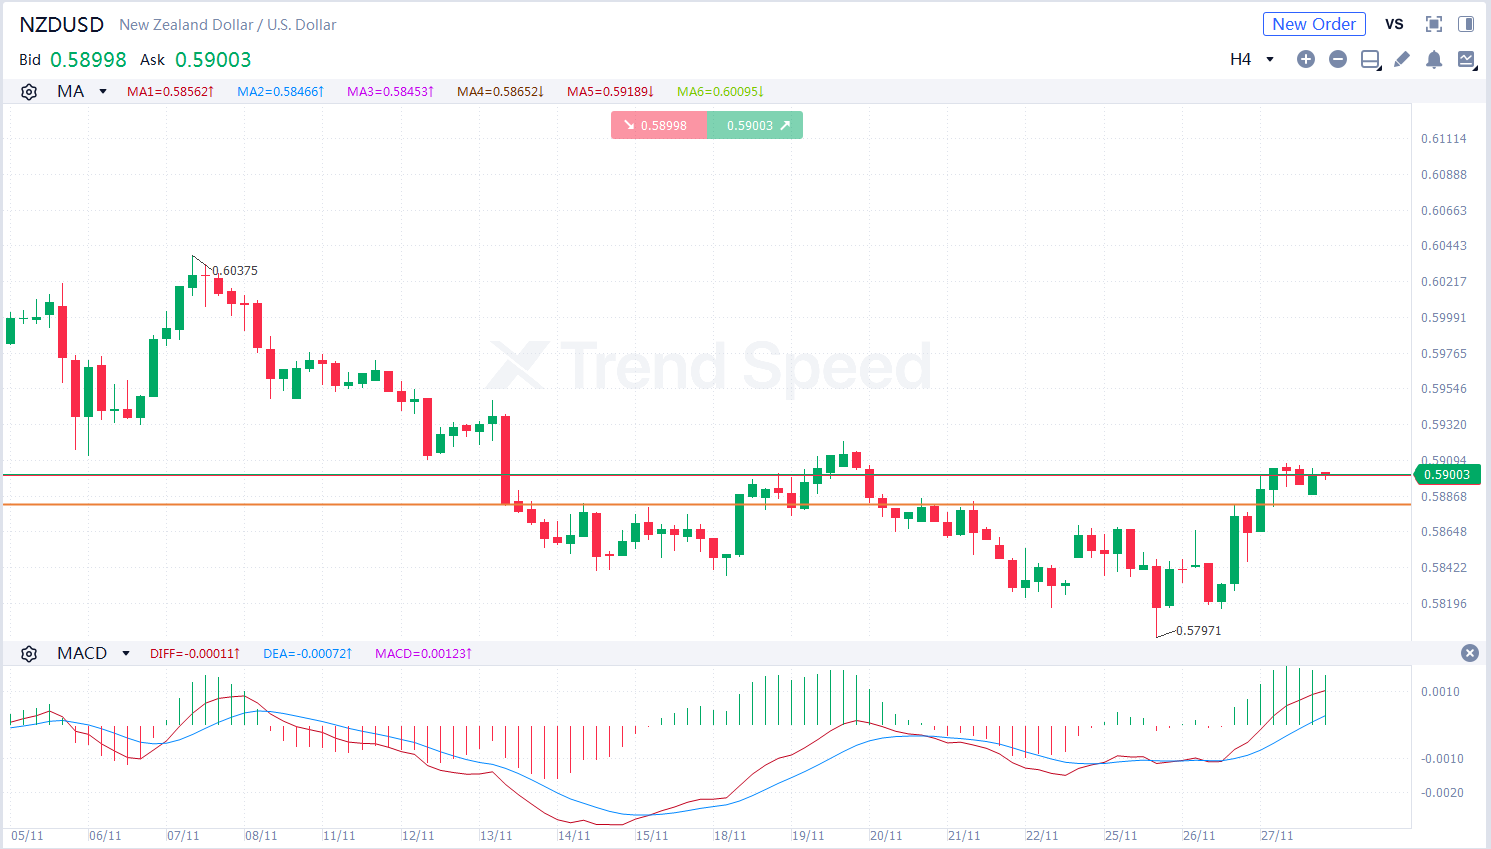 4-hour chart
On the 4-hour chart, NZDUSD was prone to fluctuation and climbed. The bullish market trend prevailed. In terms of technical indicators, MACD went upwards after the golden cross, showing that the market trend is bullish. Investors should focus on whether NZDUSD will break through the support at 0.588. It will rise further if it retreats but is stable at 0.588.
Key resistance:0.592,0.598
Key support:0.588,0.582
Generally speaking, NZDUSD is more likely to rise further in the short term. Investors should focus on the opportunity to go long on pullback during the day.
Hot
USDJPY Rose Above 159 on Iran Sanctions – Can Support at 159.0 Hold for a Push to 161.0?
25.08.2026
Is It Time to Buy USOIL on Dips as KDJ and MACD Golden Crosses Flash Buy Signals?
01.09.2026
Will US CPI Data Spark a Dollar Breakout or Further Losses for GBPUSD and NZDUSD?
07.09.2026
Is It Time to Sell EURUSD on Rebounds Below 1.162 as Fed Rate Hike Bets Rise?
31.08.2026
Bullish EURUSD Setup: 1.162 Support Holds as Price Tests 1.166 Resistance
10.09.2026







 Trading Central
 Argentine Football Association
 ACF Fiorentina
 Visa/Mastercard