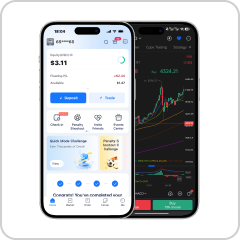
Scanne den QR-Code, um die App herunterzuladen
Bester Mobile Broker
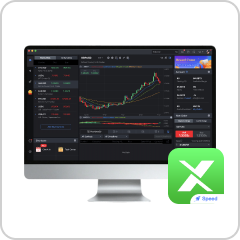
Desktop-Version herunterladen
Erweiterte Analysetools und technische Indikatoren
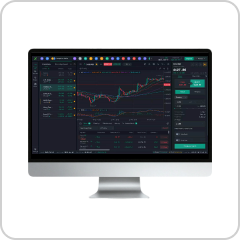
Webbasierte Handelsplattform
Handeln ohne Downloads


Deutsch
English
Deutsch
Français
Español
italiano
Português
简体中文
繁體中文
ViệtName
Čeština
Nederlands
한국인
हिंदी
عربي
Русский
polski
български
Melayu
Ελληνικά
svenska
Српски
dansk
norsk
slovenský
Hrvatski
Analyse und Fortbildung
GOLD to bounce off from current level and continue bullish
XAUUSD ·
Wed Apr 03 10:30:39 UTC 2024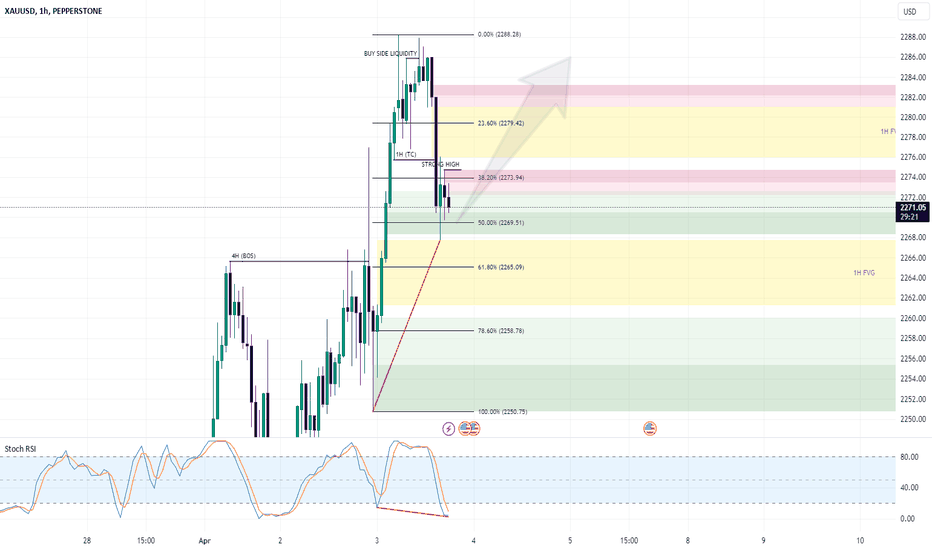
PEPPERSTONE:XAUUSD GOLD had been bullish for multiple weeks for now. Today, London had some correction moving into the news tonight. 1H chart has also created a bullish divergence. I would like to see a bounce off back towards the buy side.
Details
EUR/USD
EURUSD ·
Wed Apr 03 10:31:56 UTC 2024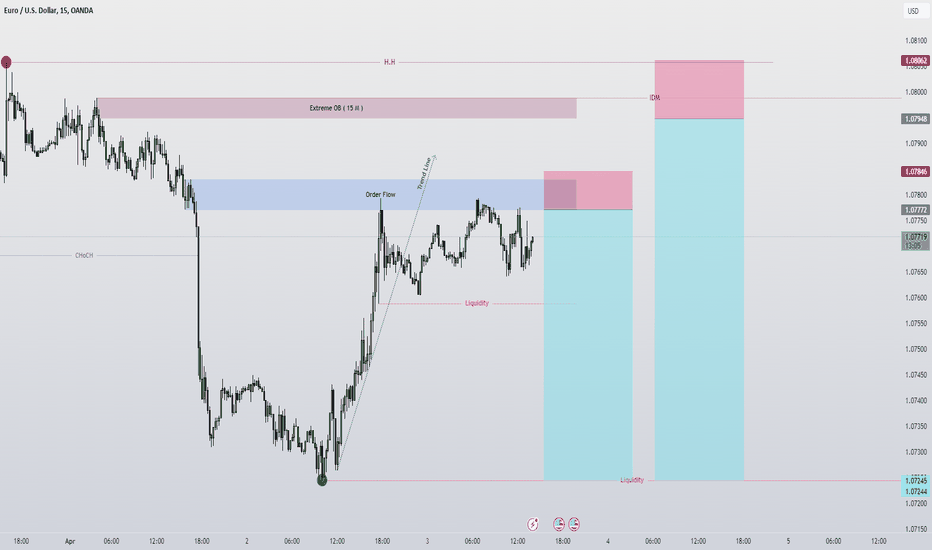
Hello dear trader friends Let's hunt for a trade time of 15 minutes Use the 1 minute time frame to enter! In the picture, I clearly defined everything so that there is no need for additional explanations. Example of Mark Douglas (Eat like a sparrow, poop like an elephant) Smart Money Liquidity Hunter
Details
Above 2260, gold will continue its bullish pattern
XAUUSD ·
Wed Apr 03 10:33:10 UTC 2024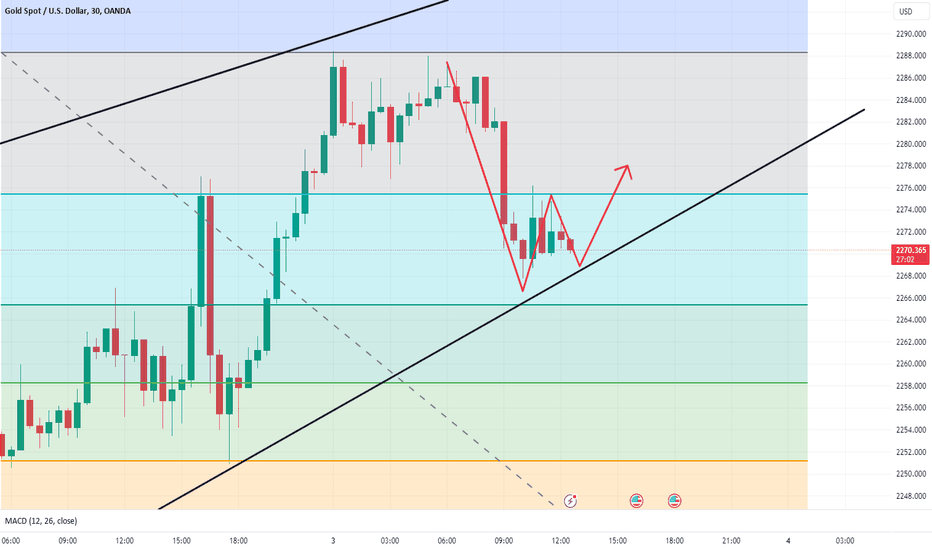
Dear friends, gold hit its highest level near 2288 and then fell back. It is currently trading near 2271. Gold is currently showing an irrational market. On the one hand, due to the expansion of the situation in the Middle East and the conflict between Russia and Ukraine, safe-haven assets have been rushing into the market. On the other hand, silver and oil have...
Details
EURJPY
EURJPY ·
Wed Apr 03 10:33:42 UTC 2024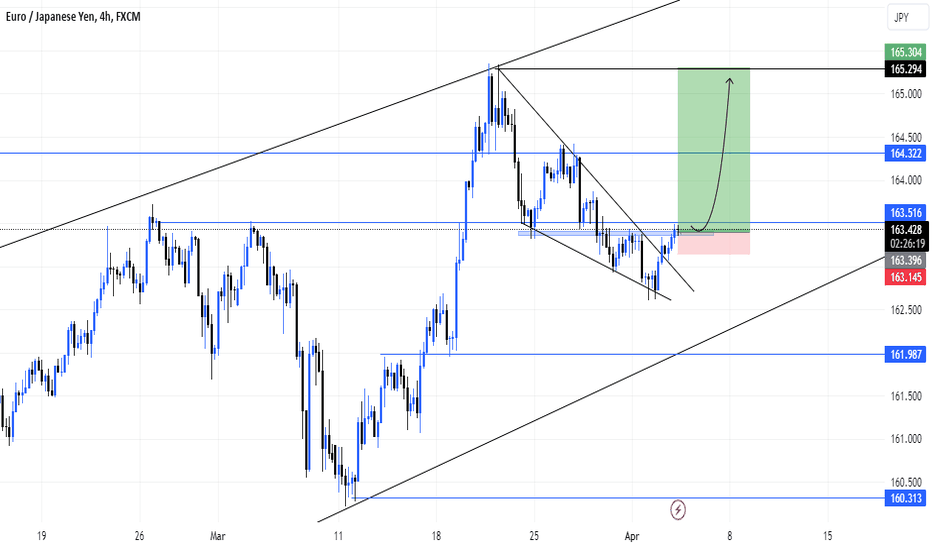
EURJPY has been in an overall uptrend shown from a top down analysis meaning that we are mostly looking for buying opportunities. EURJPY has given us an ascending triangle in the 4hr timeframe making a good confirmation for a buy opportunity. Inside the triangle we have an inverse head & shoulder showing a trend reversal as another confirmation why it is going to...
Details
GBP/JPY - Potential Upside Opportunity from Key Support Level
GBPJPY ·
Wed Apr 03 10:35:34 UTC 2024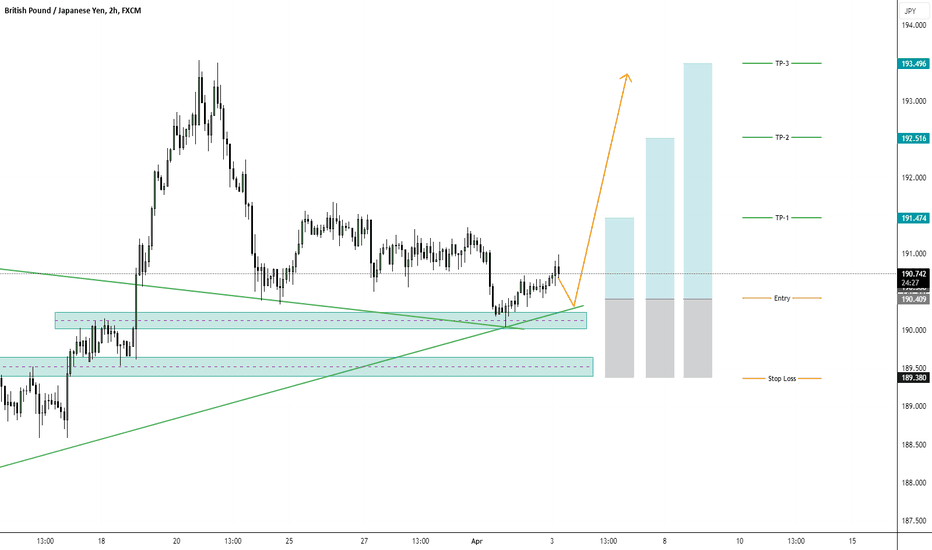
Key Support Level Analysis: GBP/JPY currently finds itself positioned at a crucial support level, indicating a potential opportunity for upward movement in the market. This support level, identified at 190.400, has historically demonstrated a significant influence on price action. Entry Strategy: Traders looking to capitalize on the anticipated upward...
Details
divergence
XAUUSD ·
Wed Apr 03 10:35:35 UTC 2024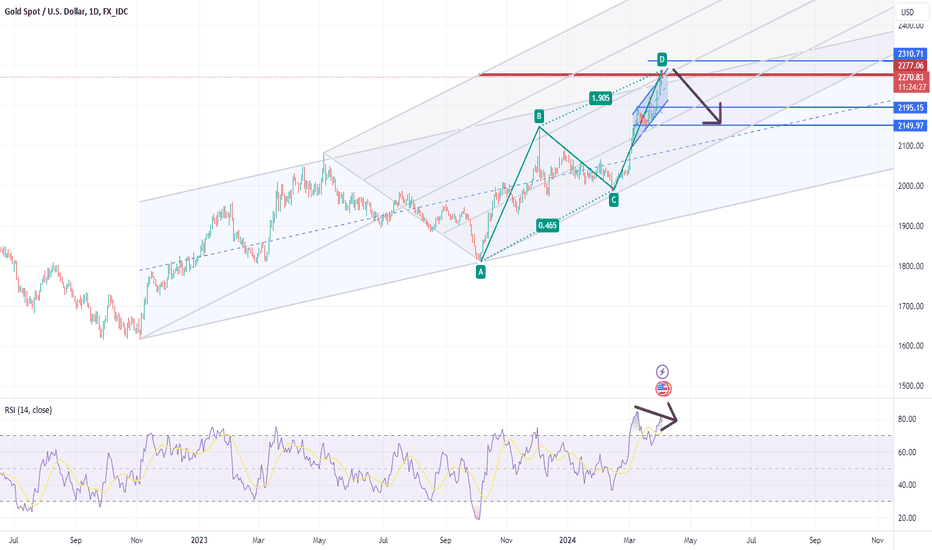
In my opinion, these gold prices are suitable for selling, all long-term and short-term resistances and classical and harmonic patterns will indicate the decline of gold.
Details
GOLD.. where is today support ? holding or not?
XAUUSD ·
Wed Apr 03 10:19:35 UTC 2024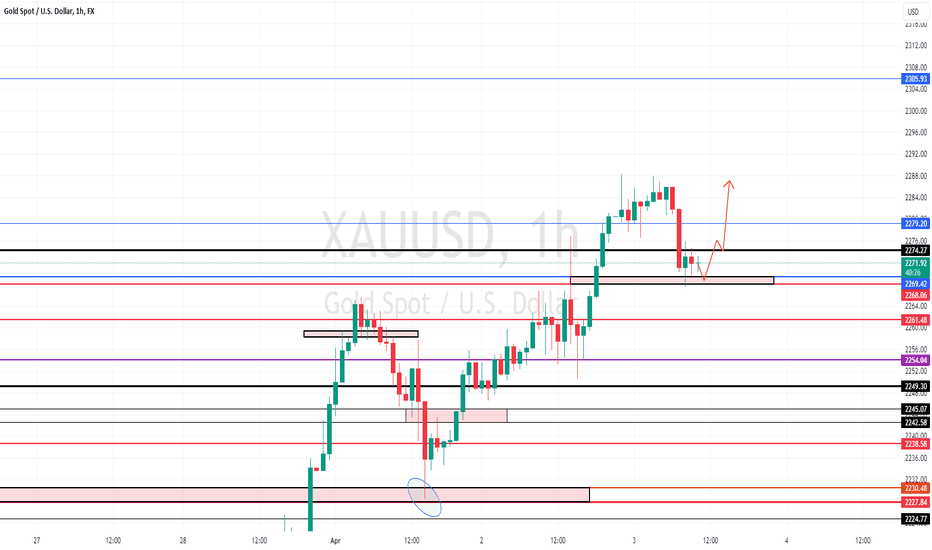
#GOLD.. well guys market exact move as per our video analysis in morning, now market have today supporting area at 2268 keep close it because it will play key role in today, lots of datas on table in today, and you have only supporting area 2268, stay sharp here, only invalid if market close below 2268 good luck trade wisely
Details
eur/usd short
EURUSD ·
Wed Apr 03 10:19:51 UTC 2024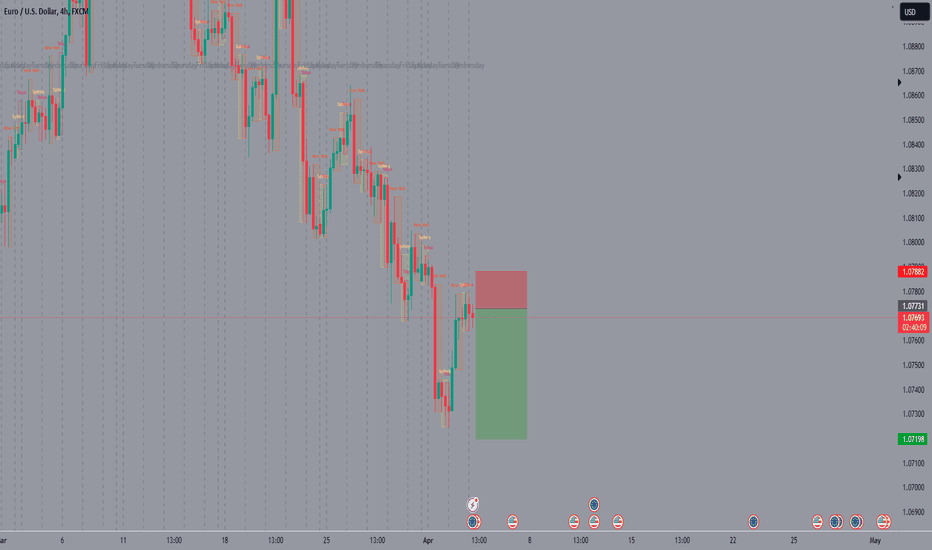
I think price will make a new low.......................................................................................................................................................................................
Details
Gold reached a new peak and is expected to continue to increase
XAUUSD ·
Wed Apr 03 10:19:51 UTC 2024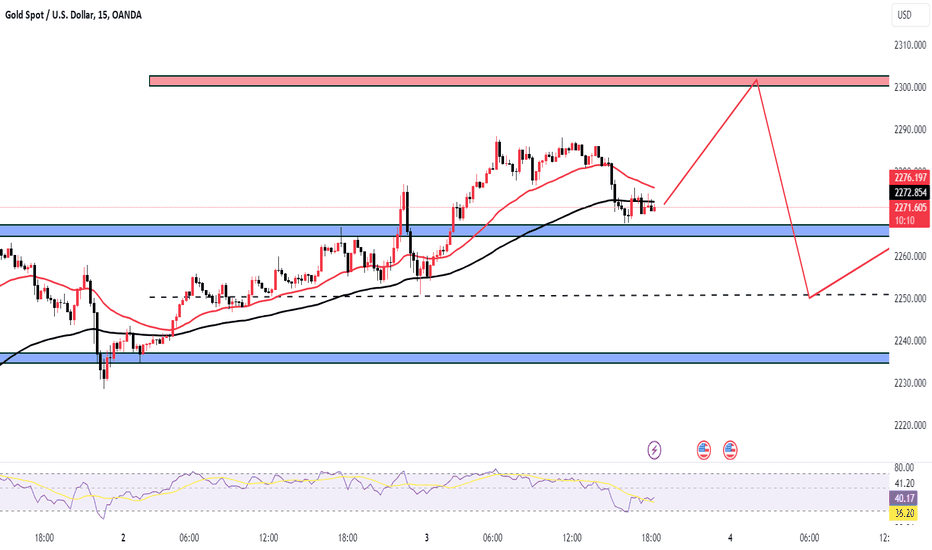
☘️Gold prices are rising as traders predict that the European Central Bank (ECB), Bank of England (BoE) and US Federal Reserve (Fed) will cut interest rates next June due to Inflation is cooling down. “As interest rates fall, gold becomes more attractive compared to fixed assets such as bonds, which offer weaker returns in a lower interest rate environment,” said...
Details
Wirtschaftskalender
07-3108-0108-0208-0308-04
- Tatsächlich
- Prognose
- Prior
- 01:30
 PPI3.6-3
 - 01:30
 Non-Manufacturing PMI495050.2
 - 01:30Private Sector Credit0.80.60.7
- 01:30Housing Credit0.6-0.6
- 01:30Manufacturing PMI49.250.150.3
Iranian Government: Iranian Foreign Minister Araghchi had a phone call with Indian Foreign Minister S Jaishankar to discuss bilateral relations and the latest regional situation.
News-Flash31-07 17:54Von XTrend Speed
Iranian Government: Iranian Foreign Minister Araghchi had a phone call with Indian Foreign Minister S Jaishankar to discuss bilateral relations and the latest regional situation.
U.S. President Trump praised Nvidia (NVDA.O).
News-Flash31-07 16:23Von XTrend Speed
U.S. President Trump praised Nvidia (NVDA.O).
Pemex: P248 billion has been paid to suppliers and contractors in the first half.
News-Flash31-07 16:15Von XTrend Speed
Pemex: P248 billion has been paid to suppliers and contractors in the first half.
US President Trump: Acting Attorney General Branch should be approved.
News-Flash31-07 16:15Von XTrend Speed
US President Trump: Acting Attorney General Branch should be approved.
US President Trump: (Regarding the Anti-Weaponization Fund) They have agreed not to set up a fund.
News-Flash31-07 16:15Von XTrend Speed
US President Trump: (Regarding the Anti-Weaponization Fund) They have agreed not to set up a fund.
US President Trump: (on FIFA) We never talked about a deal.
News-Flash31-07 16:13Von XTrend Speed
US President Trump: (on FIFA) We never talked about a deal.


Live-Mosi Live
![]() 3133 Benutzer betrachten gerade
3133 Benutzer betrachten gerade


How to use credit
NEU

How to complete "About You"?
Trading Terminology
Basic Knowledge

Open Positions:
refer to the state of a trade after a trader has entered the market. Traders can Buy or Sell to enter the market.
Closed Positions:
refers to executing a security transaction that is the exact opposite of an open position, thereby nullifying it and eliminating the initial exposure.
Close Out:
When your account's Equity reaches 50% of your Used margin , the system will automatically close out positions. The system will start closing positions that have the highest loss until the ratio is greater than 50%.
IMPORTANT NOTE: You should set “stop loss” and “take profit” in time when trading.
How to calculate profit and loss?
Product Guide
Profit/Loss = Price Difference in pips * Pip Value
For example, you buy 100 AUDUSD with a pip value of 0.01 USD and required margin of $5.
The opening price is 0.78260 and the closing price is 0.78220.
Their price difference in pips is -4 pips [(0.78220-0.78260)/0.0001 - The pip for AUDUSD is the fourth decimal point, ie. 0.0001].
Hence, the profit/loss (P/L) is -$0.04.
What is Margin Level?
Product Guide
● The margin level is a risk management gauge that helps you understand how the currently opened positions influence your account.
● Margin level is a mathematical equation that effectively tells the trader how much of their funds are available for new trades
● The higher the margin level, the higher the amount of cash available to trade
● The lower the margin level, the lower the amount of cash available to trade and the account could be subject to a margin call.
● Monitoring margin level is important for managing your account. If it falls to 100% the system will not allow you to open new positions, and in the case it falls further, some of your positions may be forcibly closed. You can raise it, either by adding funds to your account to increase equity or by closing some positions to reduce used margin.
If your margin level is getting close to 50%, you are in danger of having some of your positions forcibly closed. When the margin level is less than or equal to 50%, the positions with the greater losses will be closed out until the margin level rises above 50%. The positions opened by coupons will not be influenced and hence coupon trades will not be closed out.
How is margin level calculated?
It is calculated by the following formula:
Margin level = (equity ÷ used margin) × 100%
If you don't have any trades open, your margin level will be “- “
Margin level example
If your account equity is $8,000 and your used margin is $2,000 then your margin level is 400%.
Important Economic Data - Released Dates
Economic Calendar
NFP:
At 15:30 (GMT +2) on the first Friday of every month
GDP of major currencies (EUR, USD, GBP, AUD, NZD & JPY):
Released on a quarterly basis.
CPI of major currencies (EUR, USD, GBP, AUD, NZD & JPY) :
Released monthly.
U.S. Initial jobless Claims :
At 15:30 (GMT +2) every Thursday
U.S. Durable Goods Orders :
At 14:30 (GMT + 2) once a month
FOMC Minutes:
The Committee meets eight times a year, approximately once every 6 weeks
EIA:
At 17:30 (GMT + 2) every Wednesday
OPEC meeting:
Twice in a year, usually in June and December
Candlestick Chart
Candlestick Chart
There are two basic candlesticks:
1. Bullish Candle: When the close is higher than the open (usually green or white).
2. Bearish Candle: When the close is lower than the open (usually red or black).
There are three main parts to a candlestick:
1. Upper Shadow: The vertical line between the high of the day and the close (bullish candle) or open (bearish candle).
2. Real Body: The difference between the open and close; colored portion of the candlestick.
3. Lower Shadow: The vertical line between the low of the day and the open (bullish candle) or close (bearish candle).
Candlestick Patterns
1.White Marubozu
Formation: When the opening price equals the bottom price and the closing price equals the top price. The body colour is white or green without shadows.
Meaning: The buyers maintained control of the price - Bullish.
Forecast: It indicates the continuation at the end of an uptrend or a reversal at the end of a downtrend.
2.Black Marubozu
Formation: When the opening price equals the top price and the closing price equals the bottom price. The body colour is black or red without shadows.
Meaning: The sellers maintained control of the price - Bearish
Forecast: It indicates the continuation at the end of a downtrend or a reversal at the end of an uptrend.
3.Closing Black Marubozu
Formation: When the closing price equals the top price and no lower shadow is created.
Meaning: The sellers took control of the price - Bearish.
Forecast: It indicates the continuation at the end of a downtrend or a reversal at the end of an uptrend.
4.Hammer
Formation: Small candlestick body with a long lower shadow and a short or absent upper shadow.
Meaning: The buyers were able to overcome the selling pressure and close near the open - Bullish.
Forecast: It indicates a reversal after a downtrend or a support level which requires further bullish confirmation.
5.Shooting Star
Formation: Small candlestick body with a long upper shadow and a short or absent lower shadow.
Meaning: The sellers were able to overcome the buying pressure - Bearish.
Forecast: It indicates a reversal after an uptrend or a resistance level which requires further bearish confirmation.
6.Spinning Tops
Formation: Small candlestick body with a long upper shadow and a long lower shadow.
Meaning: Neither the sellers or the buyers were able to take over - Neutral.
Forecast: If it forms during an uptrend, it could mean that not many buyers are left and a possible reversal might occur. If it forms during a downtrend, it could mean that not many sellers are left and a possible reversal might occur.
7.Doji
Formation: Opening and closing prices are effectively equal with a long upper shadow and a long lower shadow.
Meaning: Neither the sellers or the buyers were able to take over - Neutral.
Forecast: It indicates indecision and is often formed during resting periods after a significant move either higher or lower.
The above are some types of candlestick patterns that can be formed. The different types can be categorised as single, double and triple candlestick formations. Please always take market conditions and price action signal into consideration before acting on a single candlestick pattern.


Deutsch
Deutsch
English
Deutsch
Français
Español
italiano
Português
简体中文
繁體中文
ViệtName
Čeština
Nederlands
한국인
हिंदी
عربي
Русский
polski
български
Melayu
Ελληνικά
svenska
Српски
dansk
norsk
slovenský
Hrvatski
 Handelszentrale
 Argentinische Fußballverband
 ACF Fiorentina
 Visa/Mastercard