

Ondersteuning
Mobiele handelsapp
Pc-handelsapp
Webhandelsplatform
Downloaden

Blogs over het handelen in ´s
Technical Analysis: USOIL
06.08.2025
USOIL fell to a one-month low
On Tuesday, USOIL declined for the fourth straight trading day to the lowest level since 30th June.
OPEC+ increased oil production significantly again
OPEC+ agreed recently that oil production will increase by 547 thousand barrels per day in September, aiming to regain its market share. This marks that OPEC+’s largest-scale oil production reduction plan will fully turn around.
US economic data became weak
US ISM Non-Manufacturing PMI (July) fell from 50.8 to 50.1 Vs. 51.5 (forecast), according to the data from the Institute for Supply Management.
The bearish market trend prevailed in the short term
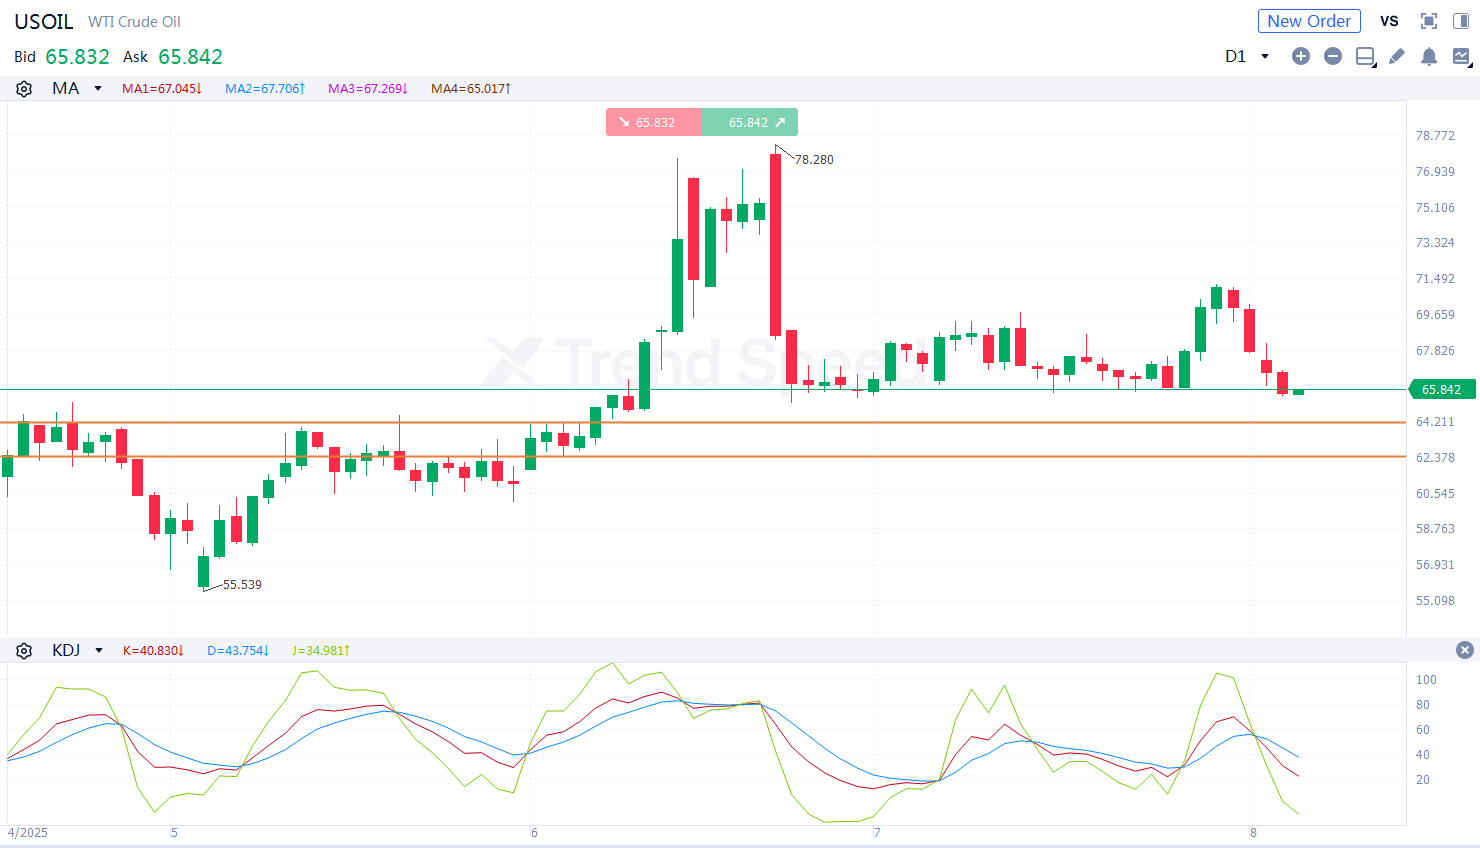
the Chart of the Day
On the chart of the day, USOIL continued closing in negative territory. The bearish market trend prevailed in the short term. In terms of technical indicators, KDJ went downwards after death cross occurred, showing that USOIL will fall further. Investors should focus on whether USOIL will break through the support at 64.0. It will decline further with potential support at 62.3 if it breaks below 64.0.
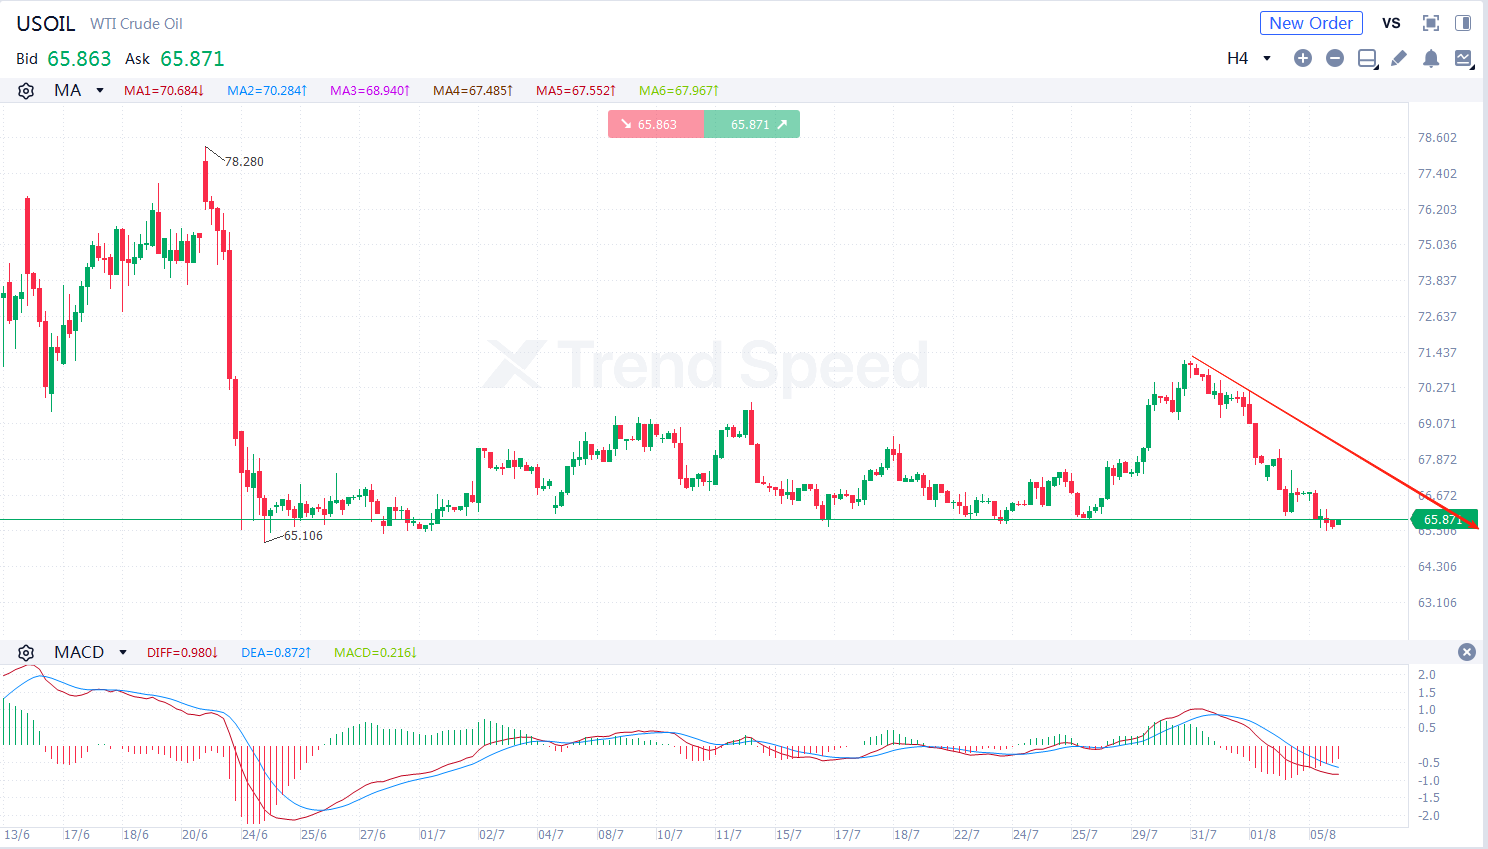 4-hour chart
On the 4-hour chart, USOIL was prone to fluctuation and declined. The bearish market trend prevailed. In terms of technical indicators, MACD went downwards after death cross occurred, showing that the bearish market trend prevailed. Investors should focus on whether USOIL will break through the resistance at 66.7. It will decline if it rebounds but is capped at 66.7.
Key resistance: 66.7,68.2
Key support: 64.0,62.3
Generally speaking, the bearish market trend prevailed in the short term. Investors should focus on US EIA Crude Oil Inventories during the day.
Populair
Technische analyse: EURUSD
16.07.2025
Technische analyse: EURUSD
30.07.2025
Technische analyse: USDJPY
17.07.2025
Technische analyse: USDCAD
31.07.2025
Technische analyse: XAUUSD
22.07.2025

Mobiele handelsapp
Pc-handelsapp
Webhandelsplatform

AFA REGIONALE SPONSOR
AFA REGIONALE SPONSOR
Markten
Analyse
Opleiding
Signalen
Handel
Meer
 Handel centraal
 Argentijnse voetbalbond
 ACF Fiorentina
 Visa/Mastercard
zijn complexe instrumenten met hoge risico's. Gelieve voorzichtig te beleggen.