

Supporto
App per il trading mobile
App per il trading su PC
Piattaforma di Trading Web
Scarica

Blog sul trading
Technical Analysis: AUDUSD
28.08.2025
AUDUSD rose to a one-week high
On Wednesday, AUDUSD climbed for the second straight trading day, and broke above the 0.650 mark to the highest level since 18th August.
Australian CPI exceeded expectations in July
Australian CPI increased by 2.8% year on year in July, which was higher than the forecast of 2.3% and marked the highest level since July 2024, according to the data from the Australian Bureau of Statistics.
The USDX climbed and then fell
On Wednesday, the USDX climbed and then fell. It ended down 0.06% at 98.147.
The bullish market trend prevailed in the short term
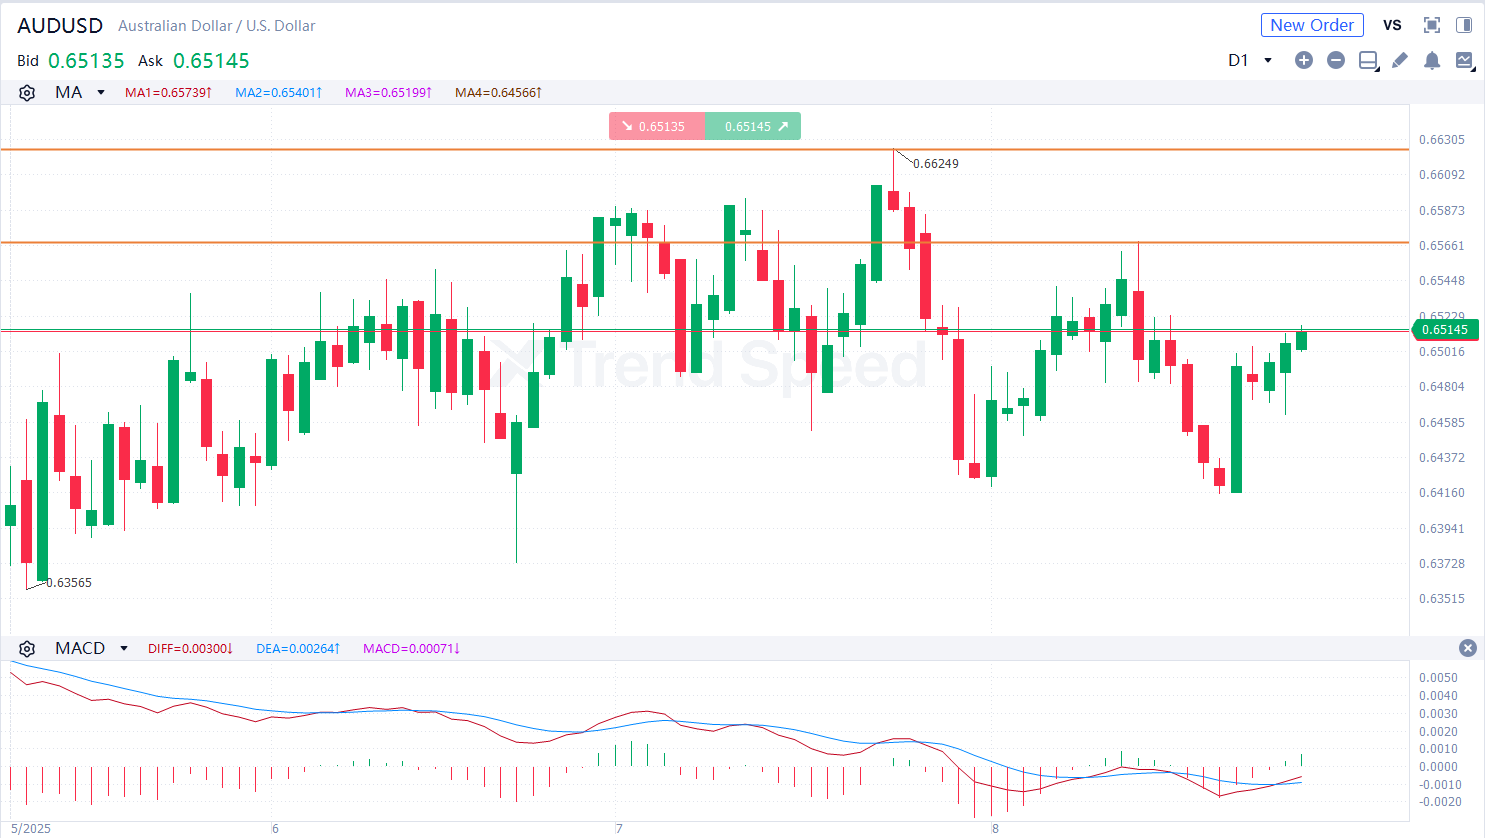 the Chart of the Day
On the chart of the day, AUDUSD rose steadily. The bullish market trend prevailed in the short term. In terms of technical indicators, MACD went upwards after golden cross occurred, showing that AUDUSD will climb further. Investors should focus on whether AUDUSD will break through the resistance at 0.657. It will jump with potential resistance at 0.662 if it breaks above 0.657.
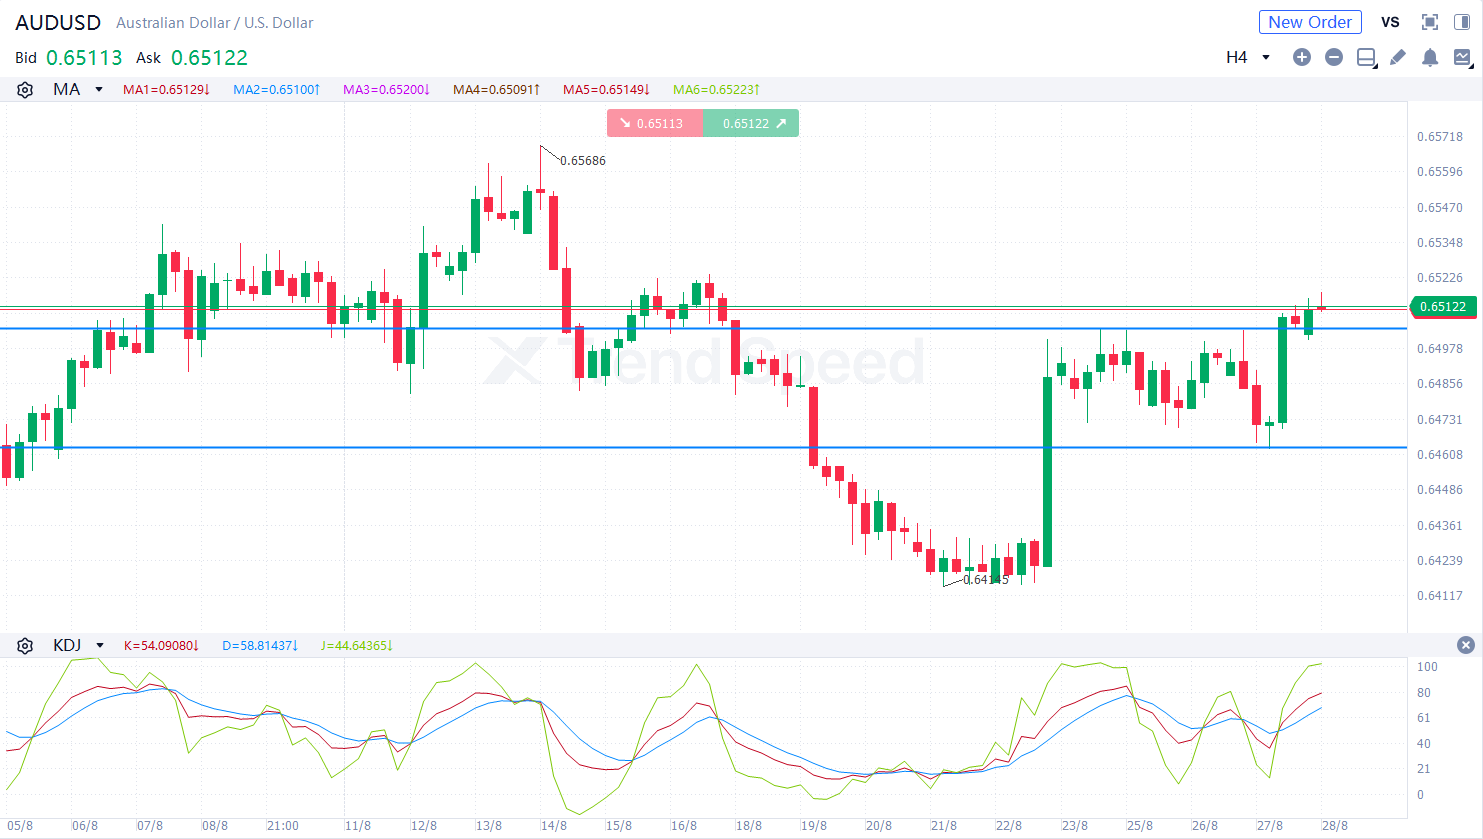 4-hour chart
On the 4-hour chart, AUDUSD was prone to fluctuation and climbed. The bullish market trend prevailed in the short term. In terms of technical indicators, KDJ went upwards after golden cross occurred, showing that the market trend is bullish. Investors should focus on whether AUDUSD will break through the support at 0.650. It will jump if it retreats but is stable above 0.650.
Key resistance: 0.657,0.662
Key support: 0.650,0.646
Generally speaking, the bullish market trend prevailed in the short term. Investors should focus on US economic data during the day.
Caldo
Análise Técnica: GBPUSD
03.09.2025
Análise Técnica: XAUUSD
26.08.2025
Análise Técnica: USOIL
04.09.2025
Análise Técnica: USOIL
27.08.2025
Análise Técnica: AUDUSD
28.08.2025

App per il trading mobile
App per il trading su PC
Piattaforma di Trading Web

SPONSOR REGIONALE AFA
SPONSOR REGIONALE AFA
Mercati
Analisi
Formazione
Segnali
Fai trading
Altro
 Centrale commerciale
 Federazione calcistica dell'Argentina
 ACF Fiorentina
 Visa/Mastercard
sono strumenti complessi con rischi elevati. Si prega di investire con cautela.