

지원
모바일 거래 앱
PC 거래 앱
웹 트레이딩 플랫폼
다운로드

거래에 관한 블로그
Technical Analysis: AUDUSD
10.02.2026
AUDUSD reached a two-year high
On Monday, AUDUSD continued rising. At one point, it came close to the 0.710 mark, reaching a two-year high.
The RBA increased the interest rate by 25 basis points
Last week, the RBA (Reserve Bank of Australia) increased the cash interest rate by 25 basis points to 3.85%. It raised the interest rate for the first time since 2023.
The USDX fell to a one-week low
On Monday, the USDX was weak and declined to a one-week low. It ended down 0.91% at 96.79.
The bullish market trend prevailed in the short term
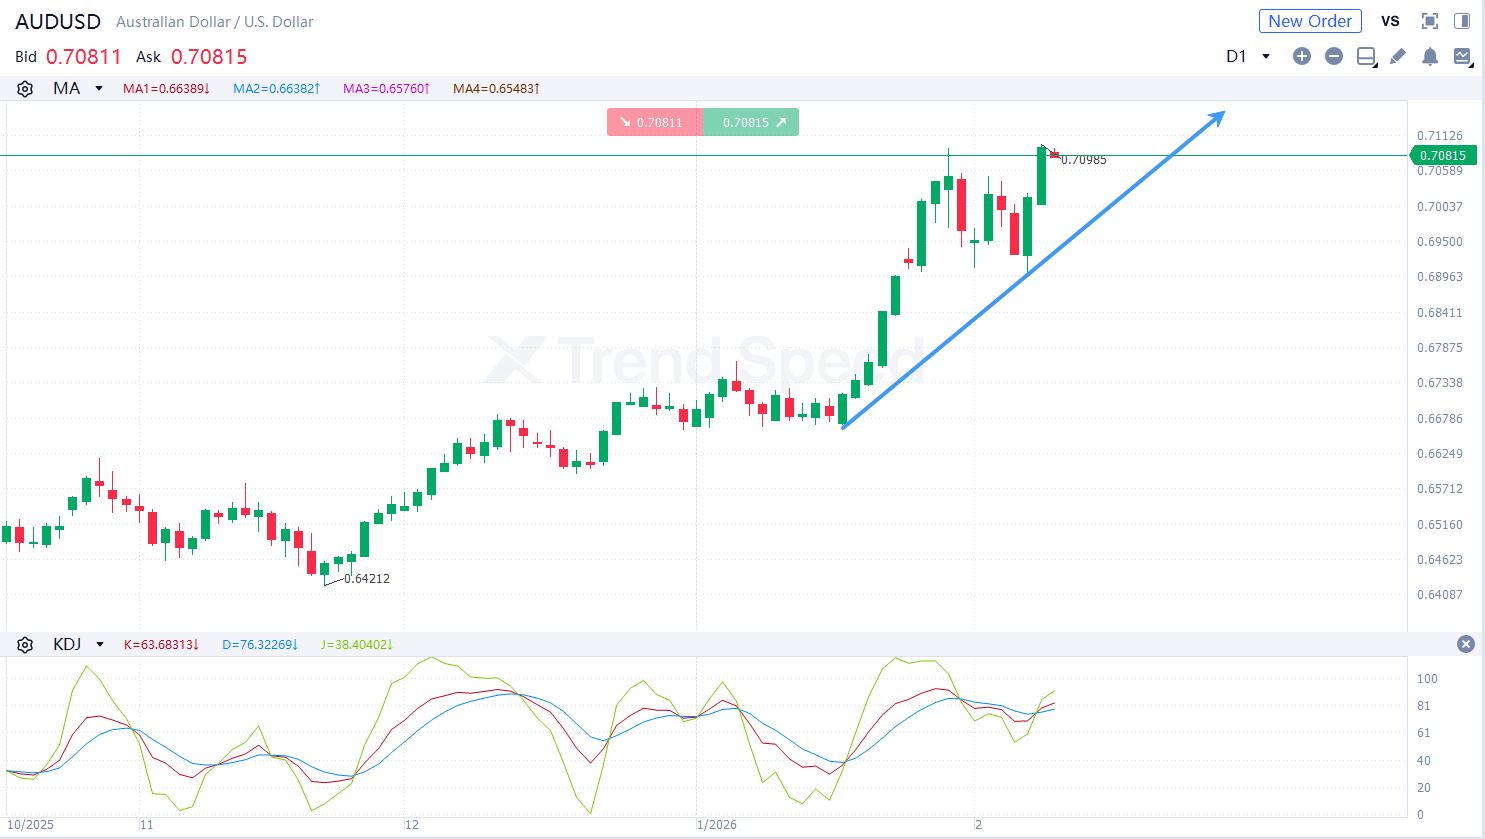
the Chart of the Day
On the chart of the day, AUDUSD rose steadily in the short term. The bullish market trend prevailed. In terms of technical indicators, KDJ went upwards after golden cross occurred, showing that AUDUSD will climb further. Investors should focus on whether AUDUSD will break through the resistance at 0.715. It will rise with potential resistance at 0.720 if it breaks above 0.715.
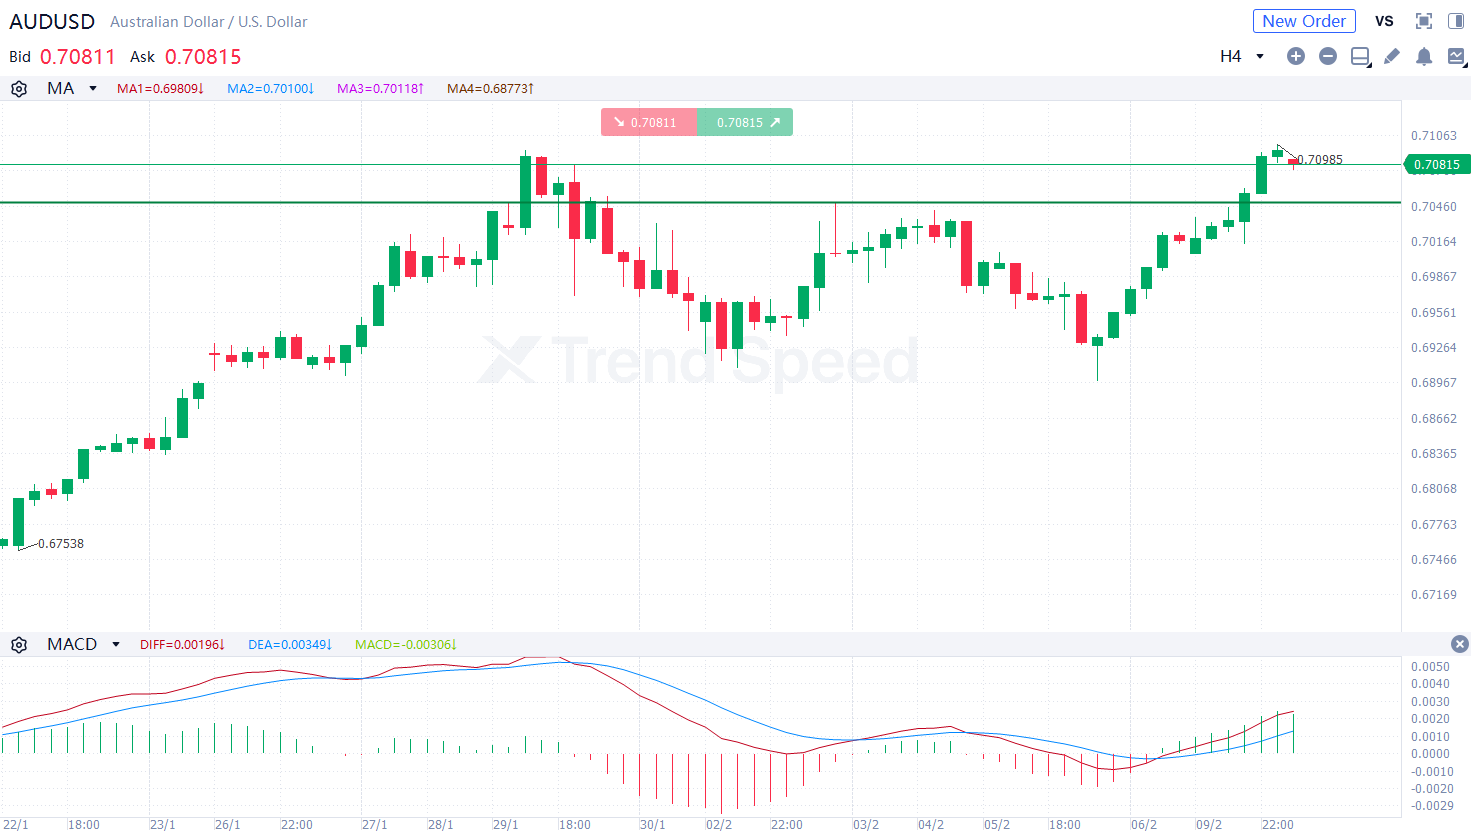
4-hour chart
On the 4-hour chart, AUDUSD was prone to fluctuation and climbed in the short term. The bullish market trend prevailed. In terms of technical indicators, MACD went upwards after golden cross occurred, showing that the bullish market trend prevailed. Investors should focus on whether AUDUSD will break through the support at 0.705. It will climb if it retreats but is stable above 0.705.
Key resistance: 0.715,0.720
Key support: 0.705,0.700
Generally speaking, the bullish market trend prevailed in the short term. Investors could buy as AUDUSD retreats during the day.
뜨거운
Technical Analysis: USDJPY
05.02.2026
Technical Analysis: USDJPY
25.02.2026
Technical Analysis: XAUUSD
24.02.2026
Technical Analysis: AUDUSD
10.02.2026
Technical Analysis: EURUSD
26.02.2026

모바일 거래 앱
PC 거래 앱
웹 트레이딩 플랫폼

AFA 지역 후원사
AFA 지역 후원사
시장
분석
교육
신호
거래
더 많은
 트레이딩 센트럴
 아르헨티나 축구 협회
 ACF 피오렌티나
 비자/마스터카드
온라인 거래는 복잡하고 위험이 높습니다. 신중하게 투자하세요.