

Support
Mobile Trading App
PC Trading App
Web Trading Platform
Download

Blogs About Trading
Technical Analysis: USOIL
18.04.2024
USOIL decreased by around 3%
On Wednesday, USOIL plunged by around 3%. It broke below the US$82 to the lowest level since March 28.
EIA crude oil inventories exceeded expectations
US EIA Crude Oil Inventories (during the week ending on April 12) fell from 5,841 thousand barrels to 2,735 thousand barrels Vs. 1,373 thousand barrels (forecast), according to the data from the EIA on Wednesday.
The US will restart sanctions on Venezuela
As Venezuela didn’t take actions as the US required, the US will restart sanctions on Venezuela’s petroleum and natural gas industry, according to the report from the CNN on April 17, local time.
The bearish market trend prevailed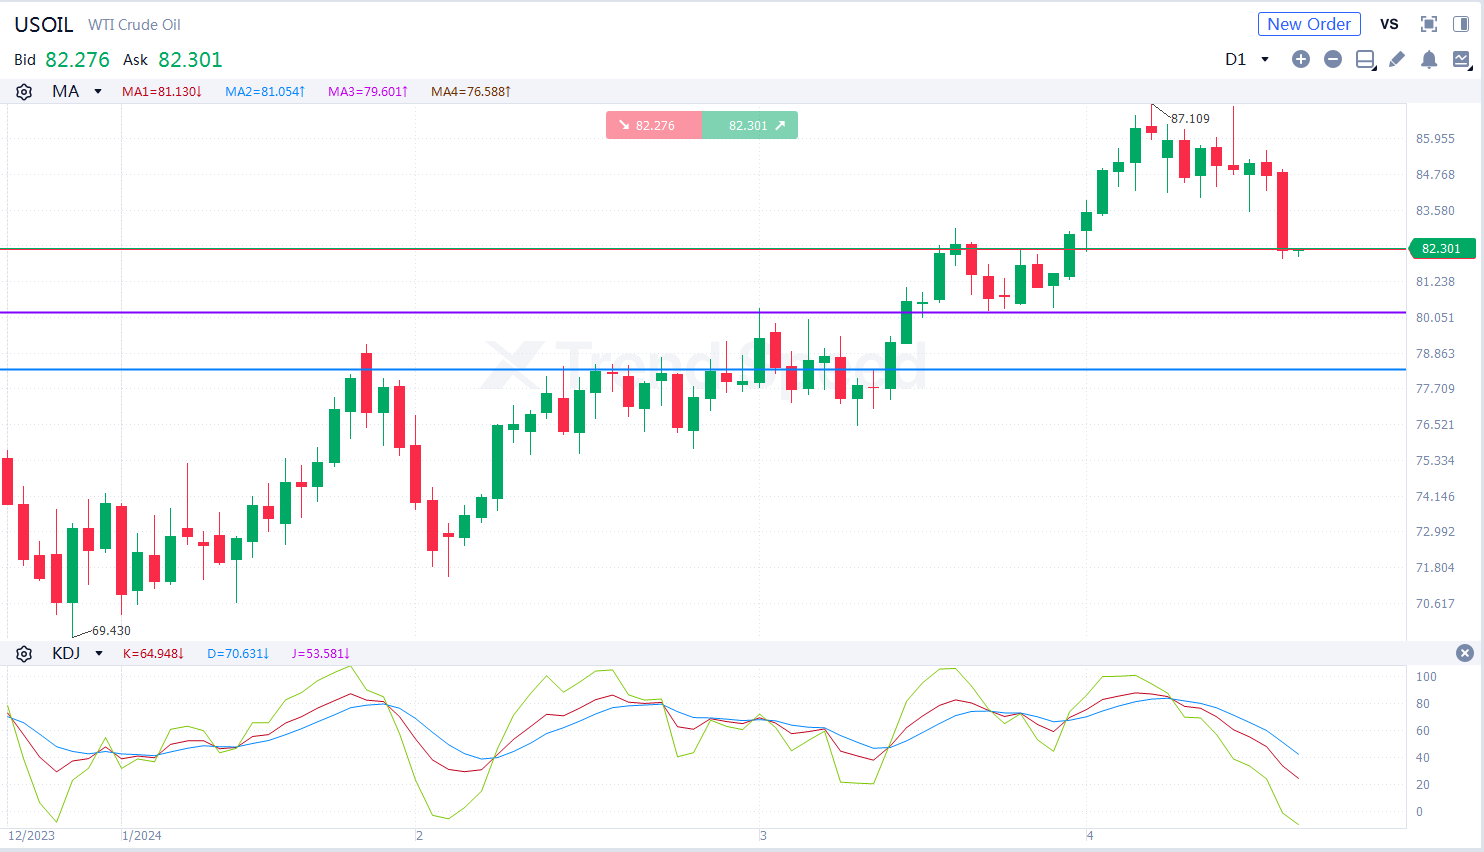
the Chart of the Day
On the chart of the day, USOIL continued falling. The bearish market trend prevailed. In terms of technical indicators, KDJ went downwards after death cross occurred, showing USOIL will fall further. USOIL will decline further with potential support at 78.3 if it breaks below the support at 80.2. 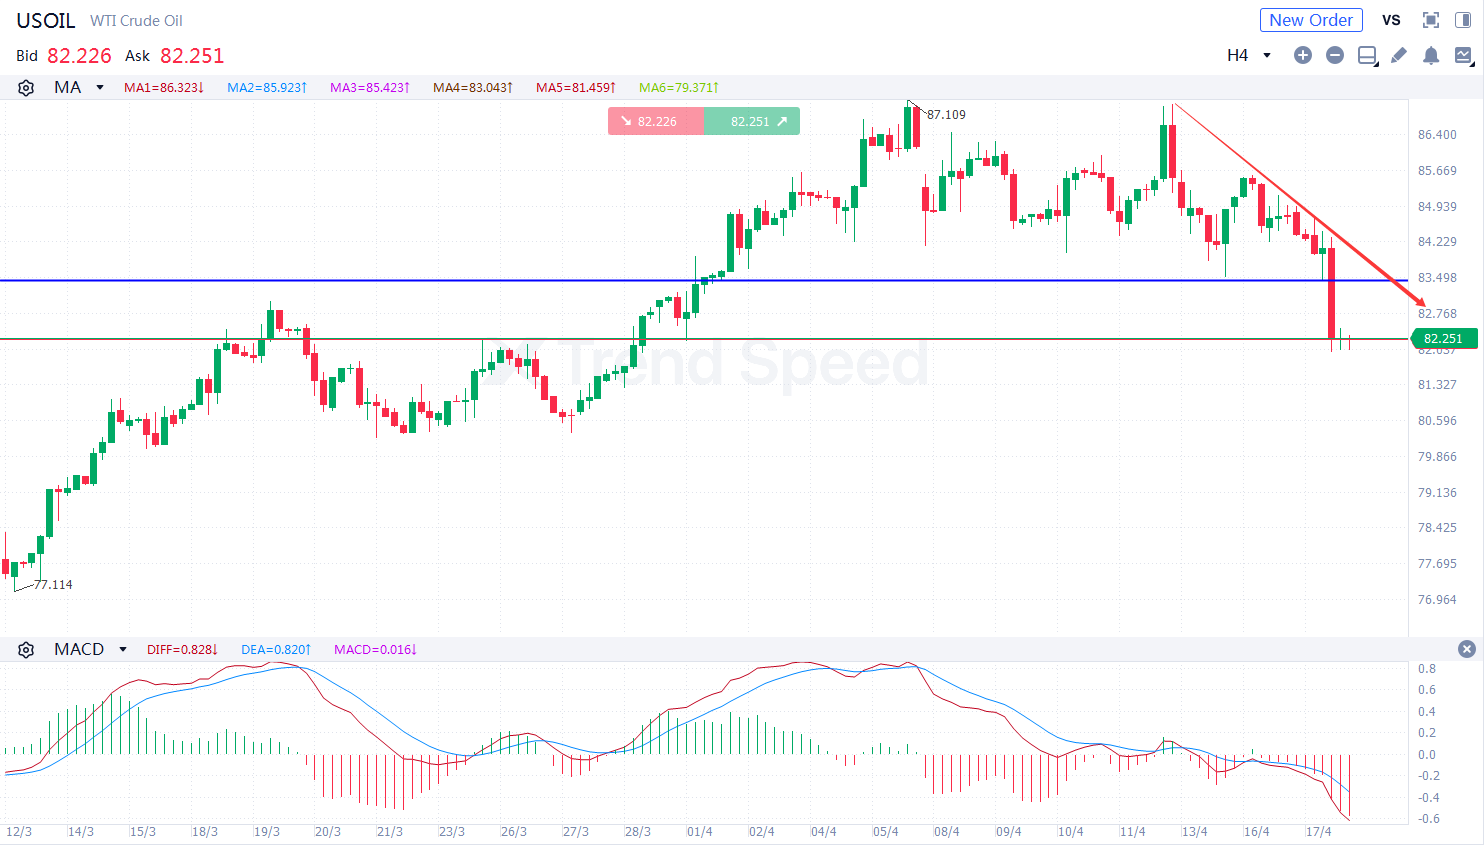
4-hour chart
On the 4-hour chart, USOIL was prone to fluctuation and declined. The bearish market trend prevailed. In terms of technical indicators, MACD went downwards after death cross occurred, showing the market trend is bearish. Investors should focus on whether USOIL will break through the resistance at 83.4. It will fall further if it rebounds but is capped at 83.4.
Key resistance: 83.4, 85.6
Key support: 80.2, 78.3
Generally speaking, USOIL is more likely to fall in the short term due to negative factors.
Hot
Technical Analysis: EURUSD
16.04.2024
Technical Analysis: USOIL
18.04.2024
Technical Analysis: AUDUSD
10.04.2024
Technical Analysis: USDJPY
25.04.2024
Technical Analysis: GBPUSD
17.04.2024

Mobile Trading App
PC Trading App
Web Trading Platform

AFA REGIONAL SPONSOR
AFA REGIONAL SPONSOR
Markets
Analysis
Education
Signals
Trade
More
 Trading Central
 Argentine Football Association
 ACF Fiorentina
 Visa/Mastercard
Online trading is complex with high risks. Please invest cautiously.